-
Notifications
You must be signed in to change notification settings - Fork 0
MoMA
This page explains the user interface of MoMA. If you want to learn how to install MoMA, you are referred to the Installation guide. If you want to learn how MoMAs input data needs to be organised, and how MoMA can be run, you are referred to our Quick user guide.
If you run MoMA using the procedure introduced in the Quick user guide, you select a data set to analyse from a dialog. You may also just open a single tif file in Fiji containing the time sequence of a single growth channel and run the menu Plugins > MoMA > Components > Apply MoMA to current image entry. Alternatively, you can open an image sequence in Fiji showing a single growth channel by just dragging and droping the folder containing the images on Fijis status bar. Then, use the Image > Hyperstacks > Stack to Hyperstack menu to enter the correct number of channels and frames. Afterwards, just run MoMA using the Plugins > MoMA > Components > Apply MoMA to current image menu entry.
Furthermore, you can run MoMA from the command line as explained here: Running MoMA from the command line
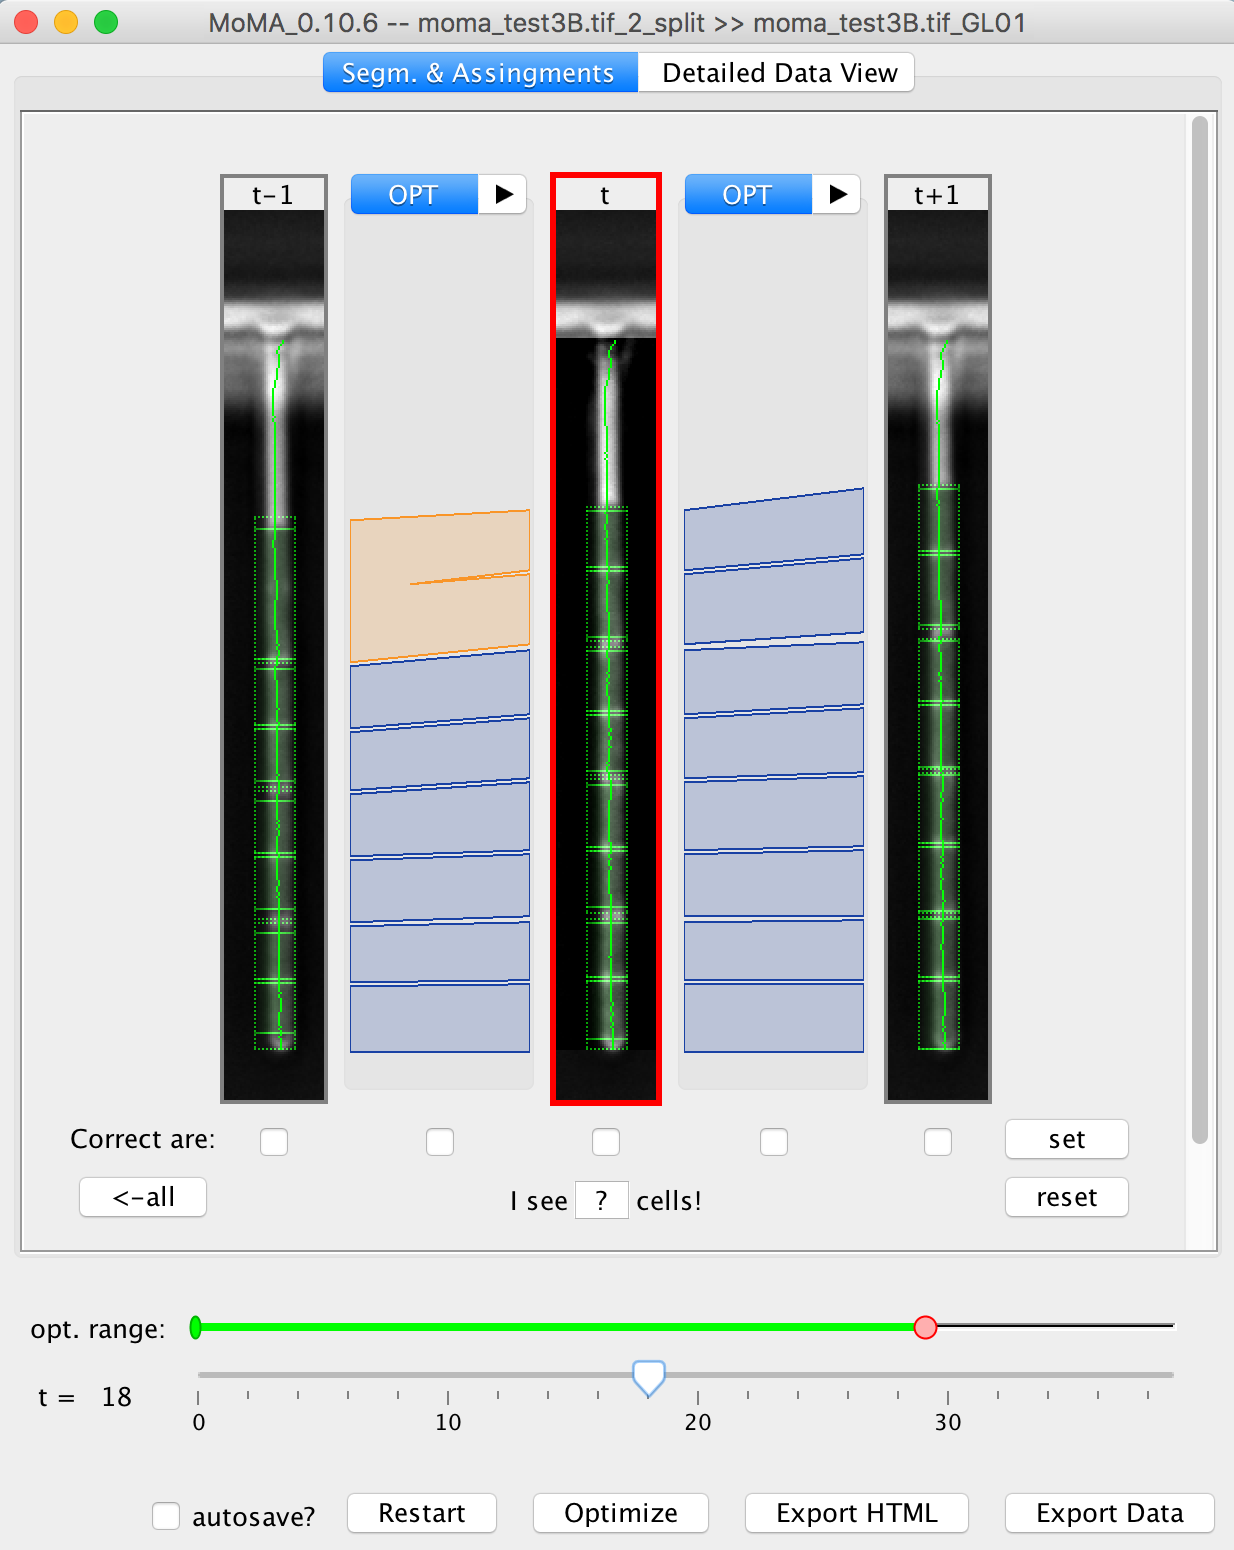
After MoMA launched, you will see MoMAs main window:

Main user interface elements are:
- Three image viewers that show three consecutive time points.
- A time slider which can be used to navigate through the time series. (Hint: use the cursor keys to navigate back and forth in time!)
- A range slider (green) to select an optimization range. This feature becomes handy if a very long time series has been loaded. When the Optimize button is clicked, only the time points chosen by this slider will be tracked (find some additional details below in subsection 'leveraged editing').
- The Optimize button starts the segmentation and tracking pipeline. Results will automatically be visualized.
- The Restart button resets MoMA's tracking.
- The Export HTML and Export Data buttons allow to save analysis results.
- At the very top, there is an additional tab: The Detailed Data View allows a closer look at the image intensities along the wiggly green line shown in the image of time point t. It also shows which segment hypotheses exist for this time point.
Once the tracking is performed (Optimize button has been clicked), MoMA will show segmented cells within the image viewers (see sample image above). Cell assignments between time points are shown in blue. Cell divisions are shown in orange, cell exits in red. Use the time slider to verify if the automatically determined solution is correct.
In case you find a tracking error, you can interact with the visualised tracking solution in the following ways:
- Hovering over any of the image viewers highlights possible cell segments. Clicking on one of those forces the tracking to include the selected segment. Use SHIFT+click to exclude a segment from the tracking solution.
- Similarly, one can interact with assignments. The assignment views can switch from
OPT(showing the found optimal tracking solution), to be showing a large set of alternative mappings, divisions, and exit assignments. These assignments can be filtered for better visibility and then, as explained above for segments, be forced or excluded by a simple mouse click. - The text field labeled with 'I see
?cells!' can be used to enforce tracking solutions that contain precisely k cells at the time point t. - After you manually corrected a time point, you may want to protect it from being changed again by the optimiser. Therefore, just activate the the Correct are checkbox below the time point. Analogously, you can protect assignments between time points. After activating such checkboxes, click the set button to save the protection. The <-all button allows protecting all time points [0,t] from modification.
| Shortcut | Function | Shortcut | Function |
|---|---|---|---|
| r | Reset optimization (tracking) | s | Show Segm. & Assignment Panel |
| o | (continue to) Optimize | d | Show Detailed Data Panel |
| v | Switch channel to show at t | b | Toggle show segment annotations |
| ?,[0-9] | I see ... cells! | e | Export data... |
| a | Press '<--all' button | g | Go to end of optimization range |
| Shortcut | Function | Shortcut | Function |
|---|---|---|---|
| click | Force segment / assignment | SHIFT+click | Hide all assignments below mouse (Available in AssignmentView) |
| CTRL+click | Avoid segment / assignment | right-click | Show all hidden assignments (Available in AssignmentView) |
| click+drag | Filter by min/max cost (Available in AssignmentView) | double-click | Enter min/max cost via textboxes (Available in AssignmentView) |
| SHIFT+CTRL+click | Prune tracking starting at segment |