-
Notifications
You must be signed in to change notification settings - Fork 409
performance
It’s easy to lose track of size/performance when you are working within the comforts of a visual tool like the Codename One Designer. When optimizing resource files you need to keep in mind one thing: it’s all about image sizes.
|
Tip
|
Images will take up 95-99% of the resource file size; everything else pales in comparison. |
Like every optimization the first rule is to reduce the size of the biggest images which will provide your biggest improvements, for this purpose we introduced the ability to see image sizes in kilobytes. To launch that feature use the menu item Images → Image Sizes (KB) in the designer.
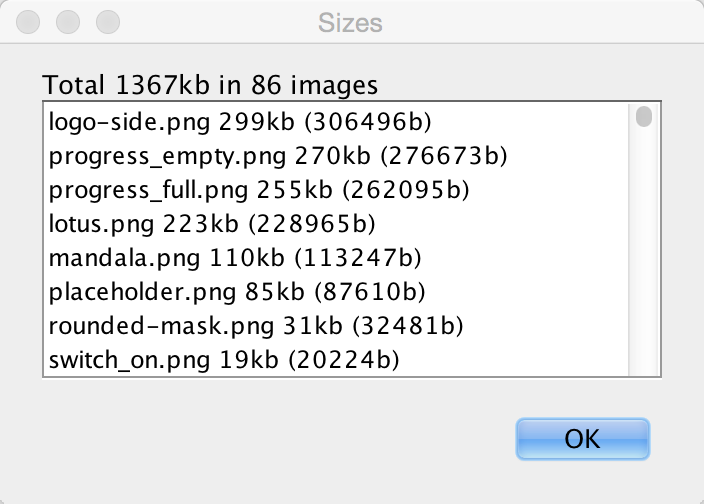
This produces a list of images sorted by size with their sizes. Often the top entries will be multi-images, which include HD resolution values that can be pretty large. These very high-resolution images take up a significant amount of space!
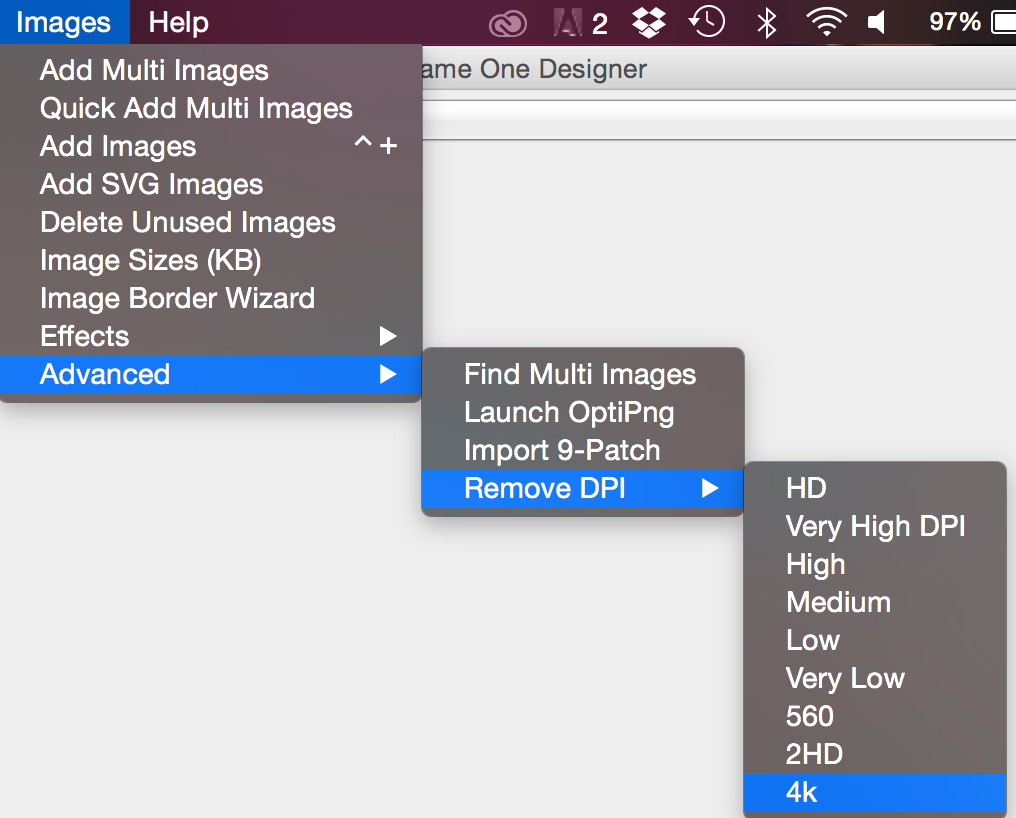
Just going to the multi-images, selecting the unnecessary resolutions & deleting these images can saves significant amounts of space:
|
Tip
|
You can see the size in KB at the top right side in the designers image viewer |
Applications using the old GUI builder can use the Images → Delete Unused Images menu option (it’s also under the Images menu). This tool allows detecting and deleting images that aren’t used within the theme/GUI.
If you have a very large image that is opaque you might want to consider converting it to JPEG and replacing the built in PNG’s. Notice that JPEG’s work on all supported devices and are typically smaller.

You can use the excellent OptiPng tool to optimize image files right from the Codename One designer. To use this feature you need to install OptiPng then select Images → Launch OptiPng from the menu. Once you do that the tool will automatically optimize all your PNG’s.
When faced with size issues make sure to check the size of your res file, if your JAR file is large open it with a tool such as 7-zip and sort elements by size. Start reviewing which element justifies the size overhead.
There are quite a few things you can do as a developer in order to improve the performance and memory footprint of a Codename One application. This sometimes depends on specific device behaviors but some of the tips here are true for all devices.
The simulator contains some tools to measure performance overhead of a specific component and also detect EDT blocking logic. Other than that follow these guidelines to create more performance code:
-
Avoid round rect borders - they have a huge overhead on all platforms. Use image borders instead (counter intuitively they are MUCH faster)
-
Avoid Gradients - they perform poorly on most OS’s. Use a background image instead
-
Use larger images when tiling or building image borders, using a 1 pixel (or event a few pixels) wide or high image and tiling it repeatedly can be very expensive
-
Shrink resource file sizes - Otherwise data might get collected by the garbage collector and reloading data might be expensive
-
Check that you don’t have too many image lock misses - this is discussed in the graphics section
-
On some platforms mutable images are slow - mutable images are images you can draw on (using
getGraphics()). On some platforms they perform quite badly (e.g. iOS) and should generally be avoided. You can check if mutable images are fast in a platform usingDisplay.areMutableImagesFast() -
* Make components either transparent or opaque * - a translucent component must paint it’s parent every time. This can be expensive. An opaque component might have margins that would require that we paint the parent so there is often overdraw in such cases (overdraw means the same pixel being painted twice).
The Performance Monitor tool can be accessible via the Simulator → Performance Monitor menu option in the simulator. This launches the following UI that can help you improve application performance:
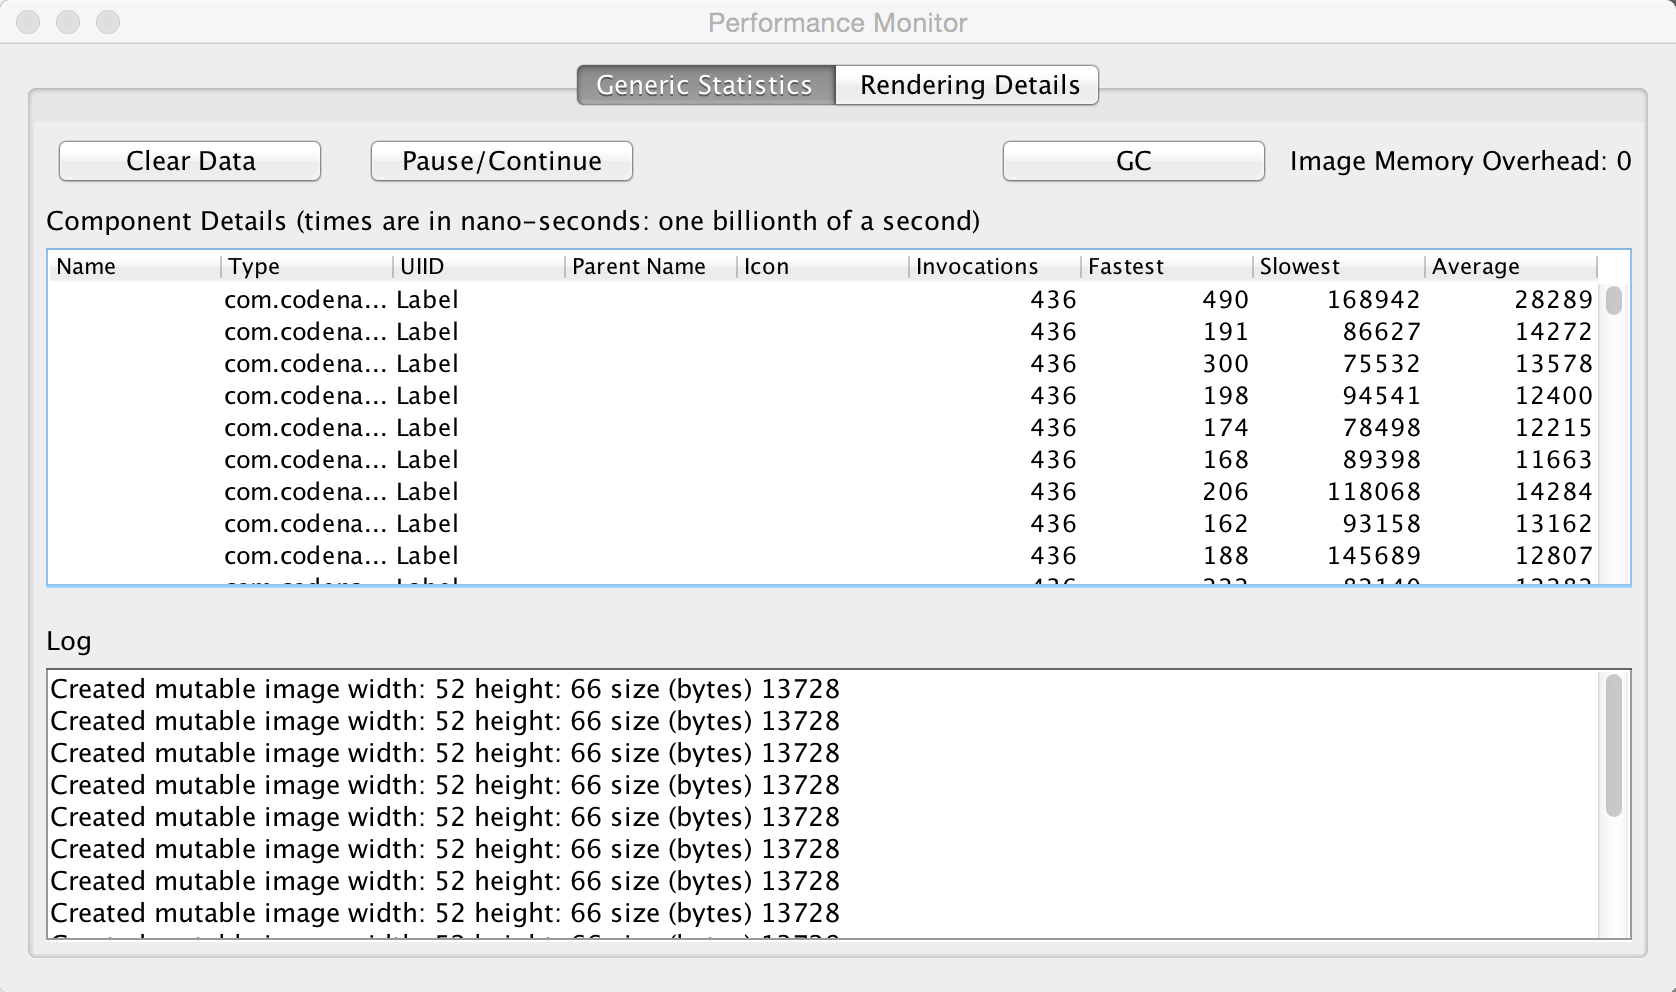
The first tab of the performance monitor includes a table of the drawn components. Each entry includes the number of times it was drawn and the slowest/fastest and average drawing time.
This is useful if a Form is slow. You might be able to pinpoint it to a specific component using this tool.
The Log on the bottom includes debug related information. E.g. it warns about the usage of mutable images which might be slow on some platforms. This also displays warnings when an unlocked image is drawn etc.
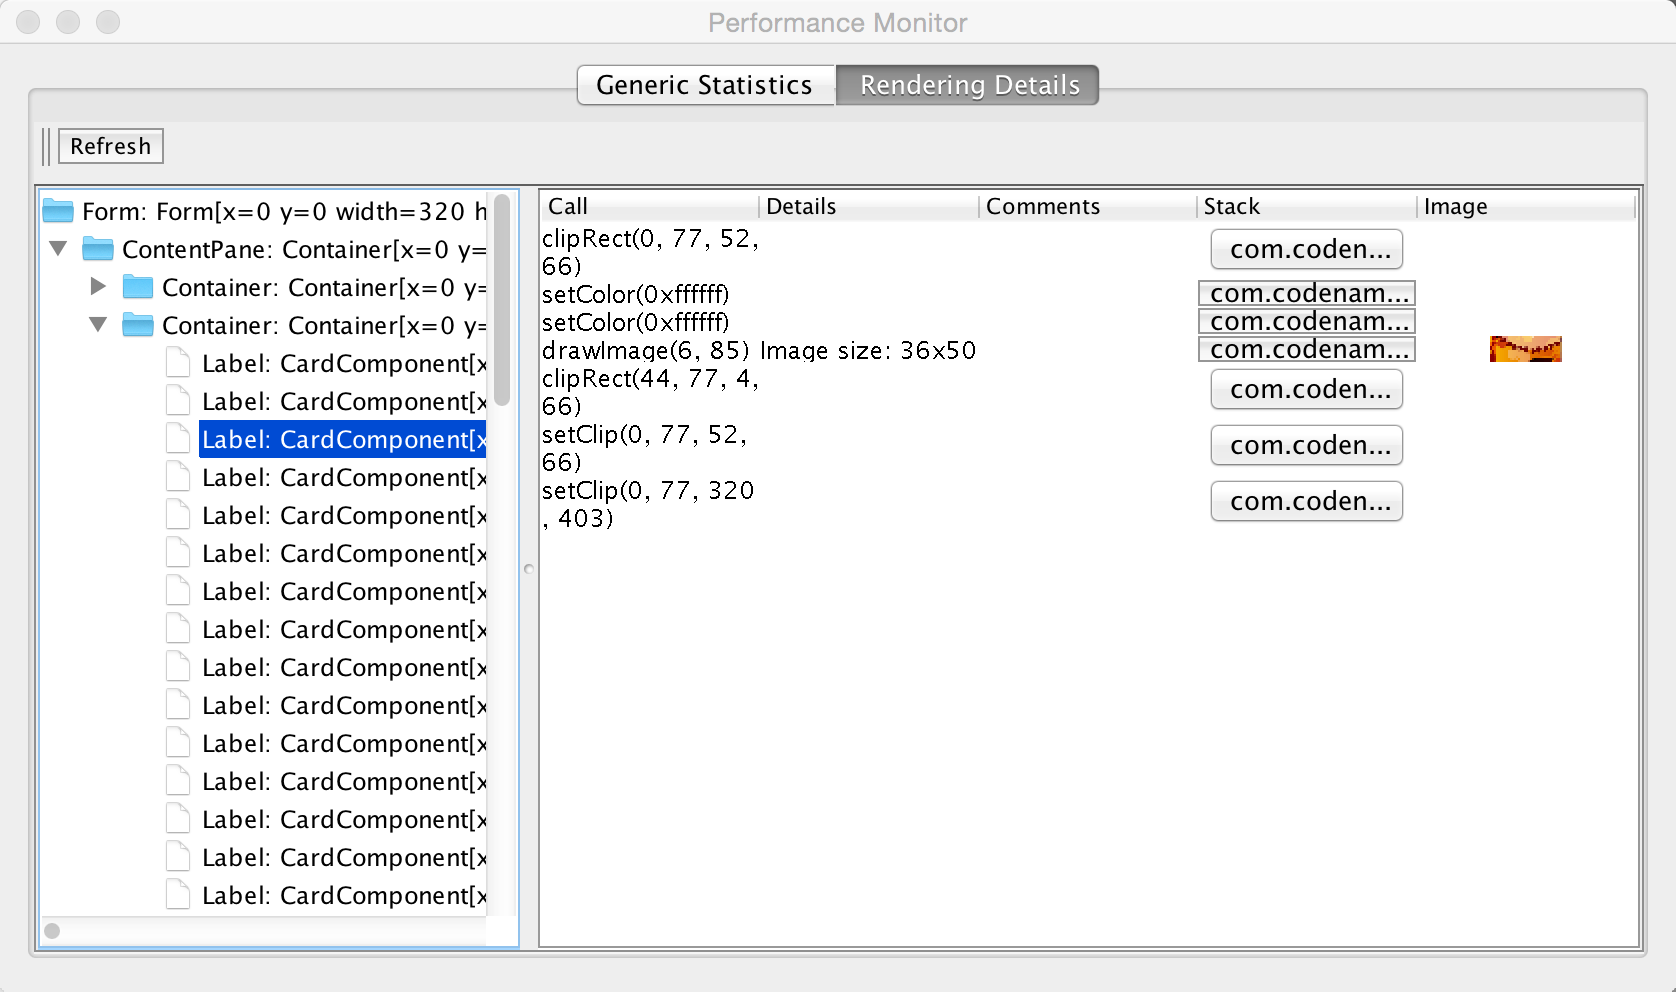
The rendering tree view allows us to inspect the hierarchy painting. You can press the refresh button which will trigger the painting of the current Form. Every graphics operation is logged and so is the stack to it.
You can then inspect the hierarchy and see what was drawn by the various components. You can click the "stack" buttons to see the specific stack trace that lead to that specific drawing operation.
This is a remarkably powerful debugging tool as you can literally see "overdraw" within this tool. E.g if you see fillRect or similar API’s invoked in the parent and then again and again in the children this could indicate a problem.
|
Tip
|
Android devices have a very nice overdraw debugging tool |

This feature is actually more useful for general debugging however it’s sometimes useful to simulate a slow/disconnected network to see how this affects performance.
For this purpose the Codename One simulator allows you to slow down networking or even fake a disconnected network to see how your application handles such cases.
When you debug your app with our source code you can place breakpoints deep within Codename One and gain unique insight. You can also use the profilers and profile into Codename One to gain similar performance specific insight.
When you run into a bug or a missing feature you can push that feature/fix back to Codename One using a pull request. Github makes that process trivial and in this new video and slides below we show you how. The steps to use the code are:
-
Signup for Github
-
Fork http://github.com/codenameone/CodenameOne and http://github.com/codenameone/codenameone-skins (also star and watch the projects for good measure).
-
Clone the git URL’s from the projects into the IDE using the Team → Git → Clone menu option. Notice that you must deselect projects in the IDE for the menu to appear.
-
Download the cn1-binaries project from github here.
-
Unzip the cn1-binaries project and make sure the directory has the name cn1-binaries. Verify that cn1-binaries, CodenameOne and codenameone-skins are within the same parent directory. .In your own project remove the jars both in the build & run libraries section. Replace the build libraries with the
CodenameOne/CodenameOneproject. Replace the runtime libraries with theCodenameOne/Ports/JavaSEPortproject.
This allows you to run the existing Codename One project with the Codename One source code and debug into Codename One. You can now also commit, push and send a pull request with the changes.
Codename One includes a built in testing framework and test recorder tool as part of the simulator. This allows developers to build both functional and unit test execution on top of Codename One. It even enables sending tests for execution on the device (pro-only feature).
To get started with the testing framework, launch the application and open the test recorder in the simulator menu.
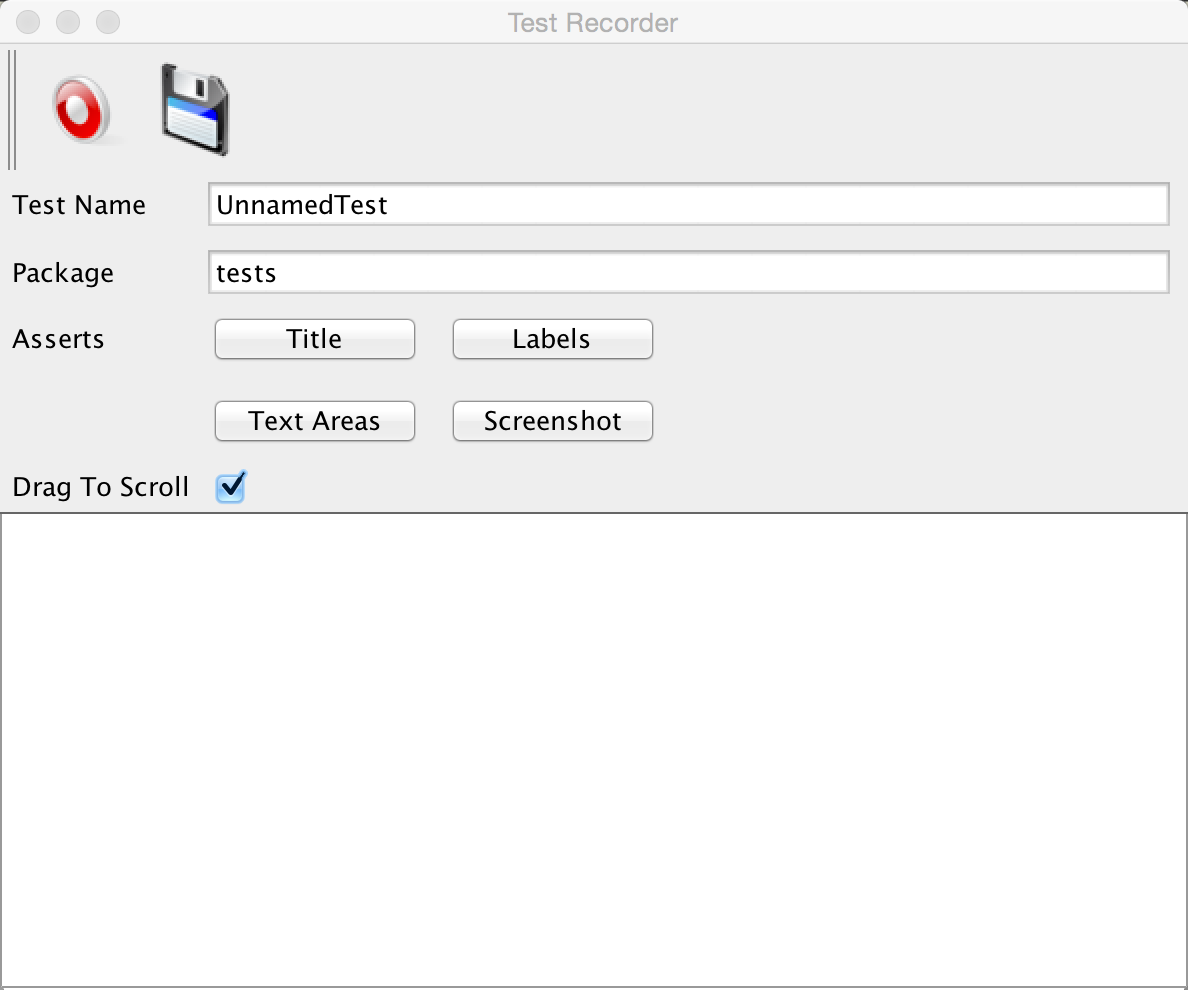
Once you press record a test will be generate for you as you use the application.
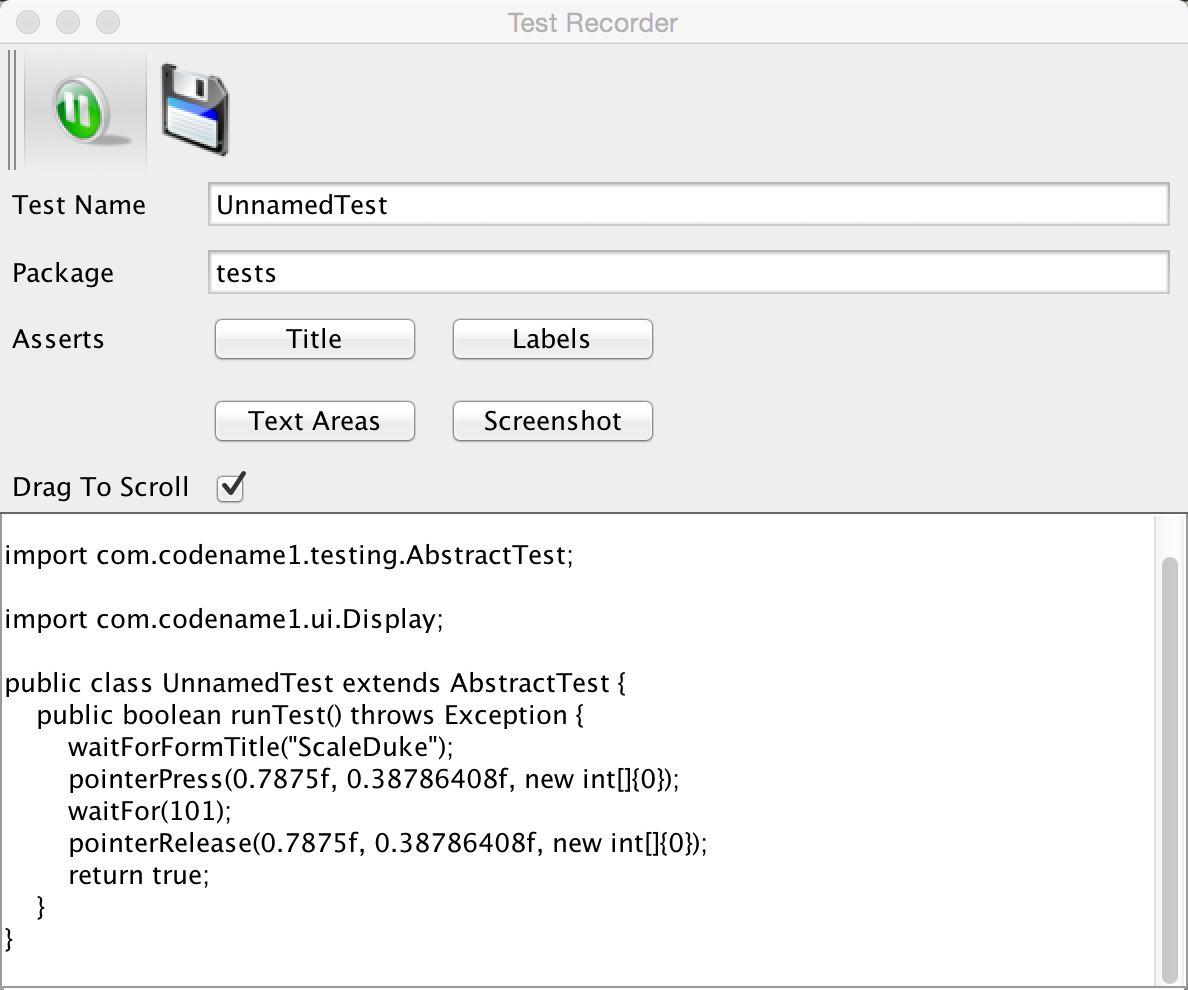
You can build tests using the Codename One testing package to manipulate the Codename One UI programmatically and perform various assertions.
Unlike frameworks such as JUnit which assign a method per test, the Codename One test framework uses a class per test. This allows the framework to avoid reflection and thus allows it to work properly on the device.
Handling errors or exceptions in a deployed product is pretty difficult, most users would just throw away your app and some would give it a negative rating without providing you with the opportunity to actually fix the bug that might have happened.
Google improved on this a bit by allowing users to submit stack traces for failures on Android devices but this requires the users approval for sending personal data which you might not need if you only want to receive the stack trace and maybe some basic application state (without violating user privacy).
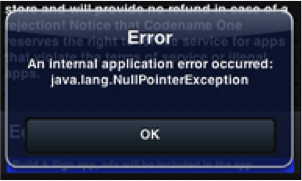
For quite some time Codename One had a very powerful feature that allows you to both catch and report such errors, the error reporting feature uses the Codename One cloud which is exclusive for pro/enterprise users. Normally in Codename One we catch all exceptions on the EDT (which is where most exceptions occur) and just display an error to the user as you can see in the picture. Unfortunately this isn’t very helpful to us as developers who really want to see the stack; furthermore we might prefer the user doesn’t see an error message at all!
Codename One allows us to grab all exceptions that occur on the EDT and handle them using the method addEdtErrorHandler in the Display class. Adding this to the Log’s ability to report errors directly to us and we can get a very powerful tool that will send us an email with information when a crash occurs!
This can be accomplished with a single line of code:
Log.bindCrashProtection(true);We normally place this in the init(Object) method so all future on-device errors are emailed to you. Internally this method uses the Display.getInstance().addEdtErrorHandler() API to bind error listeners to the EDT. When an exception is thrown there it is swallowed (using ActionEvent.consume()). The Log data is then sent using Log.sendLog().
To truly benefit from this feature we need to use the Log class for all logging and exception handling instead of API’s such as System.out.
To log standard printouts you can use the Log.p(String) method and to log exceptions with their stack trace you can use Log.e(Throwable).
Performance is one of those vague subjects that is often taught by example.
During our debugging of the contacts demo that is a part of the new kitchen sink demo we noticed its performance was sub par. We assumed this was due to the implementation of getAllContacts & that there is nothing to do. While debugging another issue we noticed an anomaly during the loading of the contacts.
This led to the discovery that we are loading the same resource file over and over again for every single contact in the list!
In the new Contacts demo we have a share button for each contact, the code for constructing a ShareButton looks like this:
public ShareButton() {
    setUIID("ShareButton");
    FontImage.setMaterialIcon(this, FontImage.MATERIAL_SHARE);
    addActionListener(this);
    shareServices.addElement(new SMSShare());
    shareServices.addElement(new EmailShare());
    shareServices.addElement(new FacebookShare());
}
This seems reasonable until you realize that the constructors for SMSShare, EmailShare & FacebookShare load the icons for each of those…
These icons are in a shared resource file that we load and don’t properly cache. The initial workaround was to cache this resource but a better solution was to convert this code:
public SMSShare() {
    super("SMS", Resources.getSystemResource().getImage("sms.png"));
}
Into this code:
public SMSShare() {
    super("SMS", null);
}

@Override
public Image getIcon() {
    Image i = super.getIcon();
    if(i == null) {
        i = Resources.getSystemResource().getImage("sms.png");
        setIcon(i);
    }
    return i;
}
This way the resource uses lazy loading as needed.
This small change boosted the loading performance and probably the general performance due to less memory fragmentation.
The lesson that we should learn every day is to never assume about performance…
Another performance pitfall in this same demo came during scrolling. Scrolling was janky (uneven/unsmooth) right after loading finished would recover after a couple of minutes.
This relates to the images of the contacts.
To hasten the loading of contacts we load them all without images. We then launch a thread that iterates the contacts and loads an individual image for a contact. Then sets that image to the contact and replaces the placeholder image.
This performed well in the simulator but didn’t do too well even on powerful mobile phones. We assumed this wouldn’t be a problem because we used Util.sleep() to yield CPU time but that wasn’t enough.
Often when we see performance penalty the response is: "move it to a separate thread". The problem is that this separate thread needs to compete for the same system resources and merge its changes back into the EDT. When we perform something intensive we need to make sure that the CPU isn’t needed right now…
In this and past cases we solved this using a class member indicating the last time a user interacted with the UI.
Here we defined:
private long lastScroll;Then we did this within the background loading thread:
// don't do anything while we are scrolling or animating
long idle = System.currentTimeMillis() - lastScroll;
while(idle < 1500 || contactsDemo.getAnimationManager().isAnimating() || scrollY != contactsDemo.getScrollY()) {
    scrollY = contactsDemo.getScrollY();
    Util.sleep(Math.min(1500, Math.max(100, 2000 - ((int)idle))));
    idle = System.currentTimeMillis() - lastScroll;
}
This effectively sleeps when the user interacts with the UI and only loads the images if the user hasn’t touched the UI in a while.
Notice that we also check if the scroll changes, this allows us to notice cases like the animation of scroll winding down.
All we need to do now is update the lastScroll variable whenever user interaction is in place. This works for user touches:
parentForm.addPointerDraggedListener(e -> lastScroll = System.currentTimeMillis());This works for general scrolling:
contactsDemo.addScrollListener(new ScrollListener() {
    int initial = -1;
    @Override
    public void scrollChanged(int scrollX, int scrollY, int oldscrollX, int oldscrollY) {
        // scrolling is sensitive on devices...
        if(initial < 0) {
            initial = scrollY;
        }
        lastScroll = System.currentTimeMillis();
        ...
    }
});|
Note
|
Due to technical constraints we can’t use a lambda in this specific case… |
About This Guide
Introduction
Basics: Themes, Styles, Components & Layouts
Theme Basics
Advanced Theming
Working With The GUI Builder
The Components Of Codename One
Using ComponentSelector
Animations & Transitions
The EDT - Event Dispatch Thread
Monetization
Graphics, Drawing, Images & Fonts
Events
File-System,-Storage,-Network-&-Parsing
Miscellaneous Features
Performance, Size & Debugging
Advanced Topics/Under The Hood
Signing, Certificates & Provisioning
Appendix: Working With iOS
Appendix: Working with Mac OS X
Appendix: Working With Javascript
Appendix: Working With UWP
Security
cn1libs
Appendix: Casual Game Programming