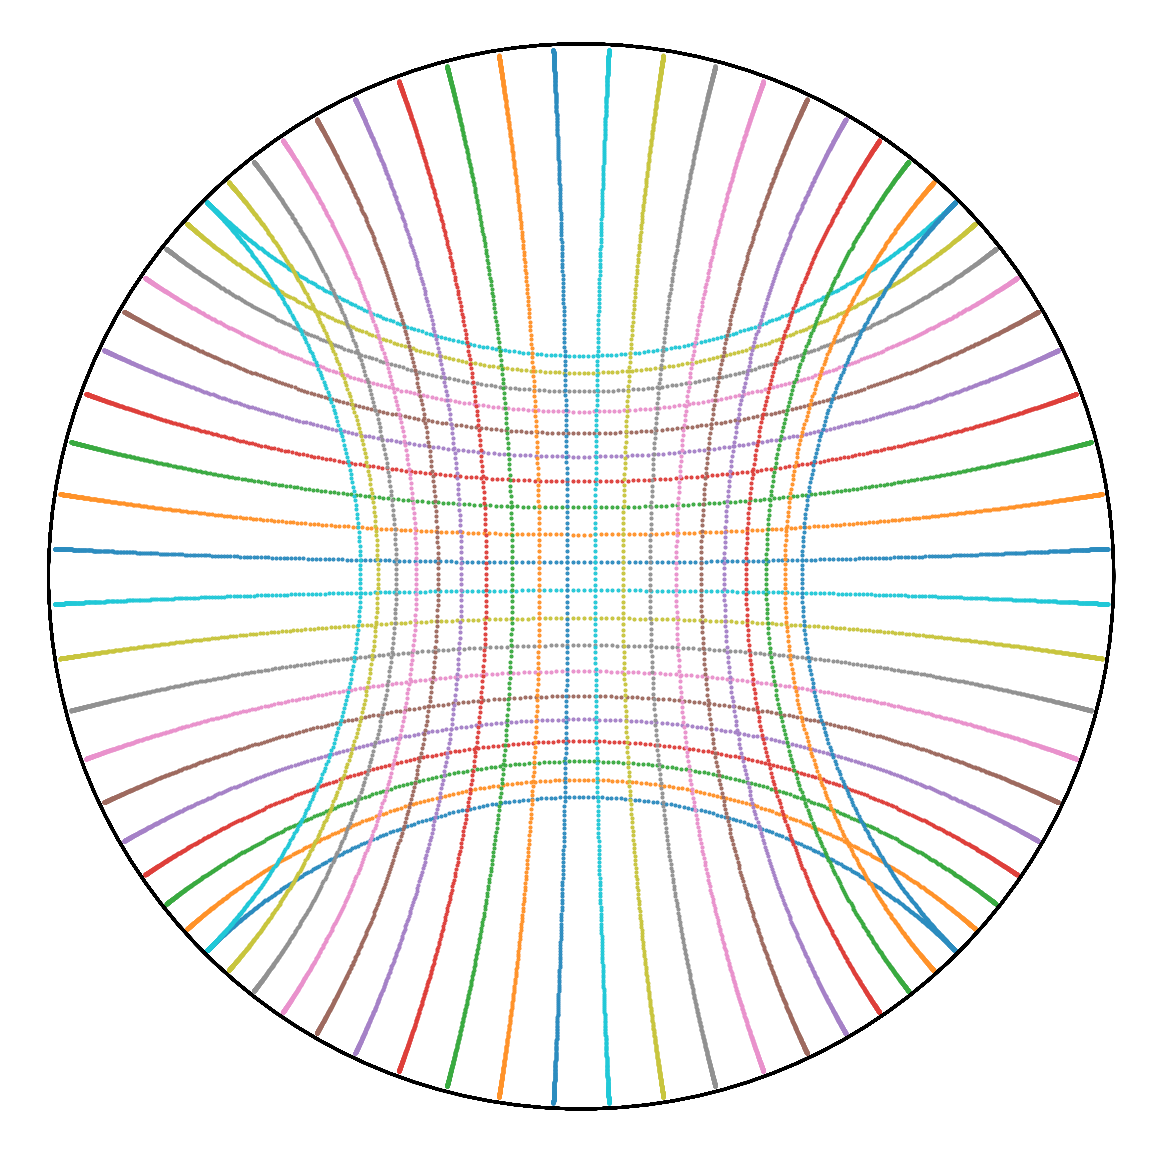
| Code | |
| Continuous Integration |  |
| Code coverage (numpy, tensorflow, pytorch) | |
| Documentation |   |
| Community |    |
NEWS: Interested in pushing forward the fields of computational differential geometry and topology? The ICLR 2021 challenge of geometry and topology is open for submissions. Deadline: May 2nd, 2021. $3500 in prizes.
Geomstats is an open-source Python package for computations and
statistics on manifolds. The package is organized into two main modules:
geometry and learning.
The module geometry implements concepts in differential geometry,
and the module learning implements statistics and learning
algorithms for data on manifolds.
- To get an overview of
geomstats, see our introductory video. - To get started with
geomstats, see the examples and notebooks directories. - The documentation of
geomstatscan be found on the documentation website. - To follow the scientific literature on geometric statistics, follow our twitter-bot @geomstats-papers!
If you find geomstats useful, please kindly cite our
paper:
@article{JMLR:v21:19-027,
  author  = {Nina Miolane and Nicolas Guigui and Alice Le Brigant and Johan Mathe and Benjamin Hou and Yann Thanwerdas and Stefan Heyder and Olivier Peltre and Niklas Koep and Hadi Zaatiti and Hatem Hajri and Yann Cabanes and Thomas Gerald and Paul Chauchat and Christian Shewmake and Daniel Brooks and Bernhard Kainz and Claire Donnat and Susan Holmes and Xavier Pennec},
  title   = {Geomstats:  A Python Package for Riemannian Geometry in Machine Learning},
  journal = {Journal of Machine Learning Research},
  year    = {2020},
  volume  = {21},
  number  = {223},
  pages   = {1-9},
  url     = {http://jmlr.org/papers/v21/19-027.html}
}
From a terminal (OS X & Linux), you can install geomstats and its
requirements with pip3 as follows:
pip3 install geomstats
This method installs the latest version of geomstats that is uploaded on PyPi. Note that geomstats is only available with Python3.
From a terminal (OS X & Linux), you can install geomstats and its
requirements via git as follows:
git clone https://github.com/geomstats/geomstats.git
pip3 install -r requirements.txt
This method installs the latest GitHub version of geomstats. Developers
should install this version, together with the development requirements
and the optional requirements to enable tensorflow and pytorch
backends:
pip3 install -r dev-requirements.txt -r opt-requirements.txt
Geomstats can run seemlessly with numpy, tensorflow or
pytorch. Note that pytorch and tensorflow requirements are
optional, as geomstats can be used with numpy only. By default, the
numpy backend is used. The visualizations are only available with
this backend.
To get the tensorflow and pytorch versions compatible with
geomstats, install the optional
requirements:
pip3 install -r opt-requirements.txt
You can choose your backend by setting the environment variable
GEOMSTATS_BACKEND to numpy, tensorflow or pytorch, and
importing the backend module. From the command line:
export GEOMSTATS_BACKEND=pytorch
and in the Python3 code:
import geomstats.backend as gs
To use geomstats for learning algorithms on Riemannian manifolds,
you need to follow three steps: - instantiate the manifold of interest,
- instantiate the learning algorithm of interest, - run the algorithm.
The data should be represented by a gs.array. This structure
represents numpy arrays, or tensorflow/pytorch tensors, depending on the
choice of backend.
The following code snippet shows the use of tangent Principal Component
Analysis on simulated data on the space of 3D rotations.
from geomstats.geometry.special_orthogonal import SpecialOrthogonal
from geomstats.learning.pca import TangentPCA

so3 = SpecialOrthogonal(n=3, point_type='vector')
metric = so3.bi_invariant_metric

data = so3.random_uniform(n_samples=10)

tpca = TangentPCA(metric=metric, n_components=2)
tpca = tpca.fit(data)
tangent_projected_data = tpca.transform(data)
All geometric computations are performed behind the scenes. The user only needs a high-level understanding of Riemannian geometry. Each algorithm can be used with any of the manifolds and metric implemented in the package.
To see additional examples, go to the examples or notebooks directories.
See our contributing guidelines!
This work is supported by:
- the Inria-Stanford associated team GeomStats,
- the European Research Council (ERC) under the European Union's Horizon 2020 research and innovation program (grant agreement G-Statistics No. 786854),
- the French society for applied and industrial mathematics (SMAI),
- the National Science Foundation (grant NSF DMS RTG 1501767).
