| Introduction | Deployment Guide |
|---|
Teams delivers chat-based collaboration, calling, meetings, and live events, so you can expand the audience of your meetings. Teams live events is an extension of Teams meetings, enabling users to broadcast video and meeting content to a large online audience. These are meant for one-to-many communications where the host of the event is leading the interactions and audience participation is primarily to view the content shared by host
When running Live Events in Microsoft Teams you have logs available to you for analysis after the event. These are
- Attendee Data - shows when attendees joined and left the live event. This could be multiple times per session
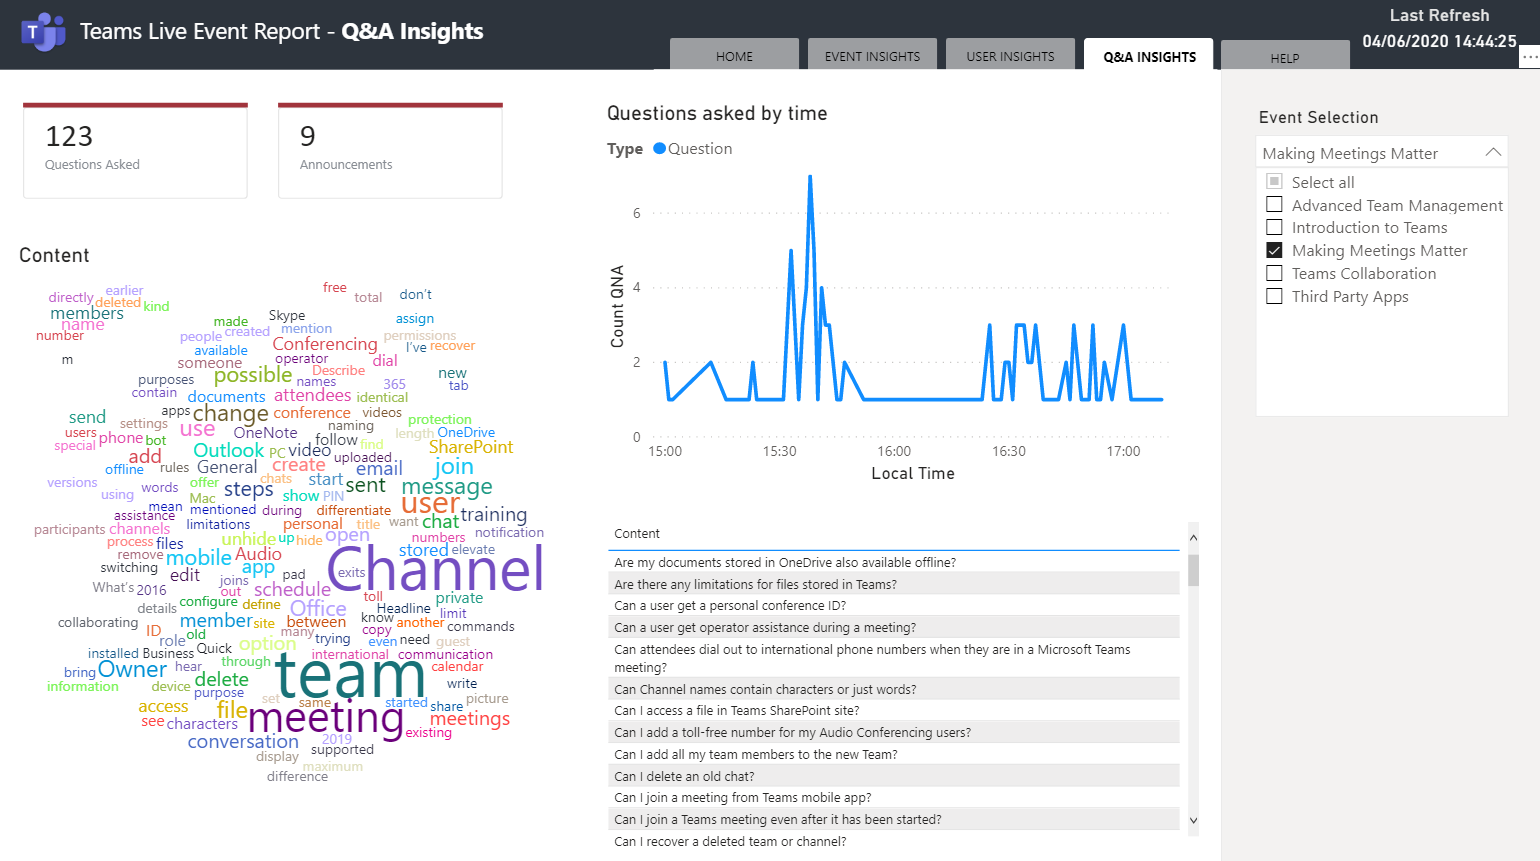
- Q&A Data - shows any questions, moderator responses and announcements shared in the live event
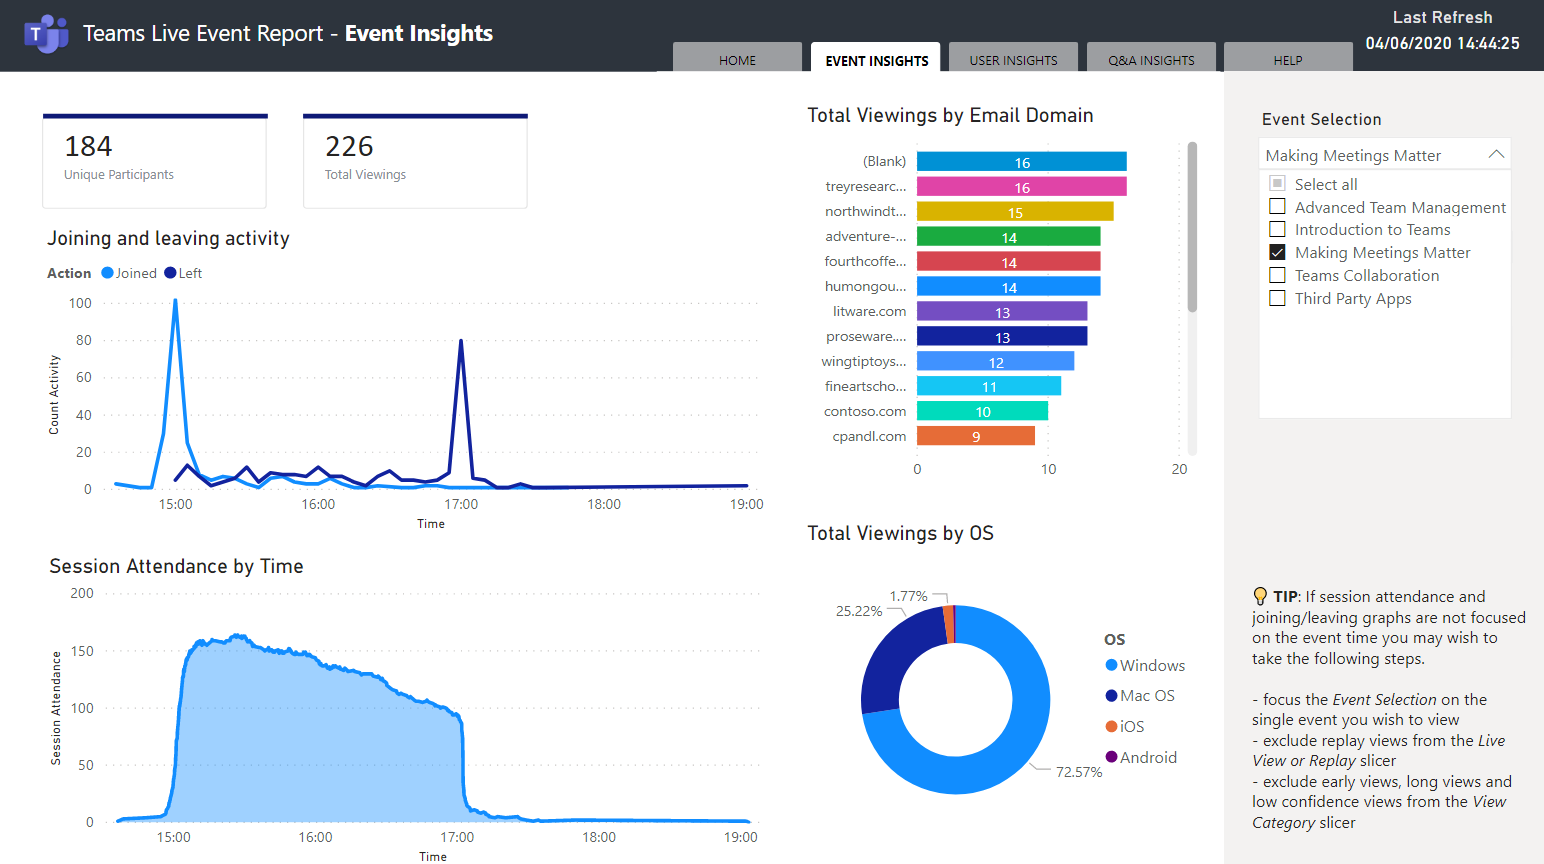
This report enables live event administrators to analyse the data from their events in an easily consumed report using Power BI.
The Power BI report supports multiple events in a series so you can analyse trends across multiple events including
- join and leave times
- question posting by time
- word cloud visualisation of the question key words
- unique participants (over a series of events)
- breakdown by email domain (where user is not anonymous)
- user attendance patterns across a series of events
- breakdown by operating system

