Network troubleshooting tool.
QuickMon is a small monitoring tool that provides instantaneous information regarding the network and application infrastructure. It was made to help us to take quick decisions in our daily tasks. Note that it's not the intention of this tool to store long term information or generate alerts, for this kind of functionality I'm very happy by using Zabbix.
Built using:
- Qt Creator;
- Qt Framework;
- QCustomPlot (already added in project source tree);
- SNMP++ API.
All binaries are statically linked, what generates single slightly bigger executables.
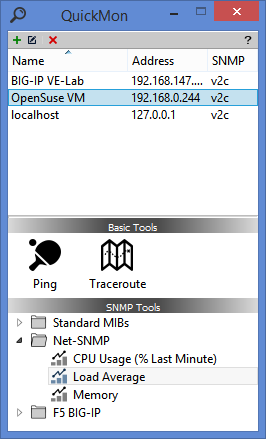
All the tools can be launched directly from main screen, what is divided in three parts.
- Hosts List: The host list is located on top of the window and permits to create, edit and remove hosts. Any host to be monitored have to be added to host list first, this is needed due to the amount of parameters required for SNMP queries for example.
- Basic Tools: Located below the host list, the basic tools can be launched by single clicks over its icons. Multiple instances of each tool can be used simultaneously.
- SNMP Tools: SNMP Tools are small groups of data collectors organized within three basic categories: lists, tables and graphs. Due to the nature of the navigation through trees, collapsing and expanding items, the SNMP Tools require double clicks to be launched. As well as the basic tools, multiples instances can be used at same time.
To initialize the tool simply drag a host from the host list and drop over the tool window. It will start the tool immediately.
Some SNMP agents may take a long time to update some OIDs, what can reduce the accuracy of instantaneous measurements and make graphs seem slightly broken. Windows SNMP and Net-SNMP are examples of agents that will take 3 or more seconds to update the ifTable.
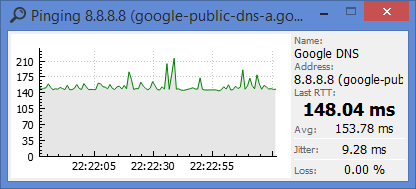
Ping tool against 8.8.8.8 Google DNS:
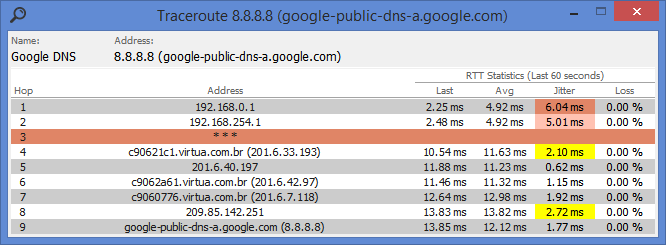
Tracerouting path to 8.8.8.8 Google DNS:
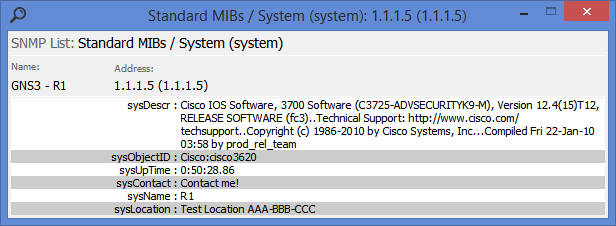
Basic system information list:
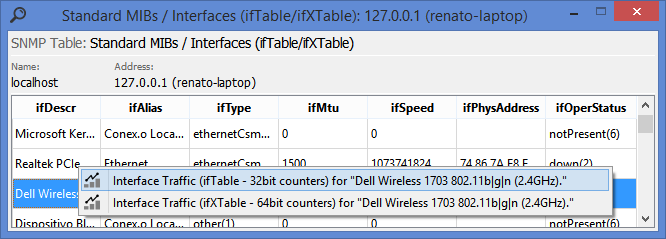
Standard interface table:
Right click over a table item shows aditional options for the given object.
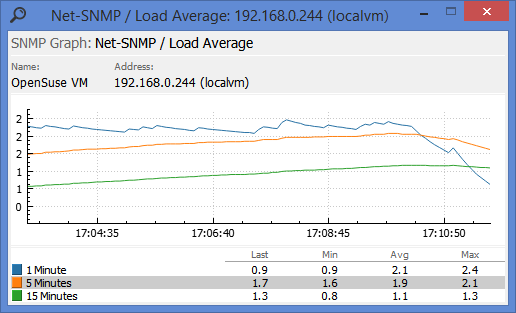
Linux load average graph:
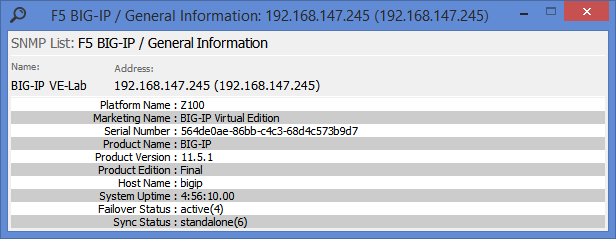
F5 BIG-IP general information list:
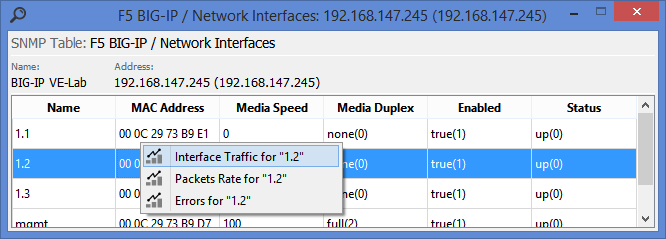
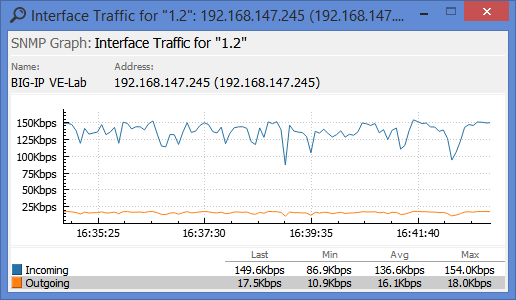
F5 BIG-IP interface table (from private mib) lauching a interface traffic graph for interface 1.2:
- Standard MIBs
- System (system/hrSystem)
- Interfaces (ifTable/ifXTable)
- Processes (hrSWRunTable)
- Software (hrSWInstalledTable)
- Storage (hrStorageTable)
- Net-SNMP
- CPU Usage (% Last Minute)
- Load Average
- Memory
- F5 BIG-IP
- General Information
- System CPU Usage
- System CPU Cores
- System Memory Used
- Network Interfaces
- Total Throughput
- Total Connections
- Total Connections Rate
- SSL Transactions Rate
- SSL Throughput
- HTTP Requests Rate
- LTM - Virtual Servers
- LTM - Pools
- LTM - Nodes
Since version v0.4.0 it's possible to add a custom template file to have your own SNMP items. Complete instructions can be found in Adding user's template.
Don't forget to submit your custom template file to us if you think that it could be useful to other users. User contributions will be added natively in future releases.
