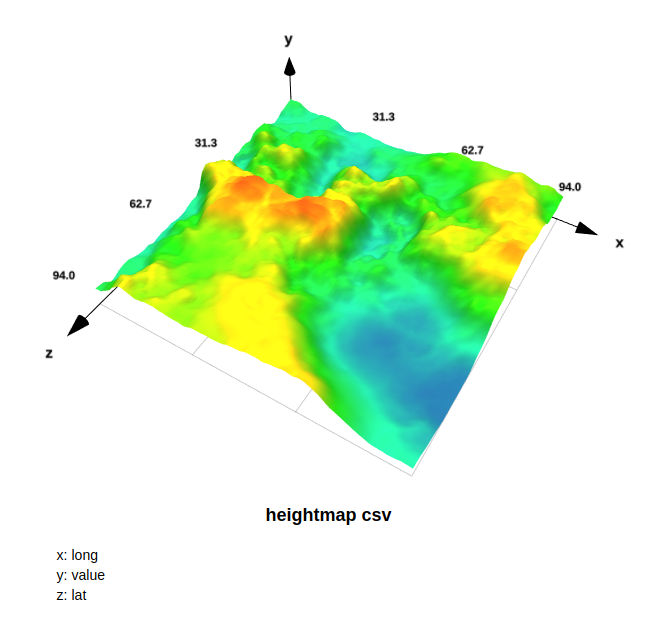
Plots functions and .csv files. Based on three.js. It is written in ES6 syntax and compiled using Webpack.
Click here for a live example:
http://hip70890b.de/JsPlot3D/examples/playground/index.html
You can uploade one of the csvs in /examples/csvFiles. Or get a .csv dataset (for example on kaggle.com). The live example also gives insight about the settings that can be handed over to plotCsvString, plotDataFrame, plotFormula and addDataPoints.
Download: http://hip70890b.de/JsPlot3D/compiled/JsPlot3D.js
How To: If you want to start using JsPlot3D, take a look at https://github.com/sezanzeb/JsPlot3D/blob/master/USAGE.md
Documentation: https://doclets.io/sezanzeb/JsPlot3D/master ("API")
Building: https://github.com/sezanzeb/JsPlot3D/blob/master/MORE.md
- scatterplots
- coloring labels
- heatmap colored datapoints
- validates and plots formulas
- barcharts
- placing autogenerated legends into the DOM
- optimized for adding/replacing datapoints quickly during runtime
- reads .csv files
- lineplots
- 2D view
You can copy the following to a file.html and open it using your browser. It should work right away and show 6 datapoints in red, blue and green and a legend below it that explainins the colors and the axes
    <div id="plot" style="width:400px; height:350px;"></div>
    <div id="legend"></div>
    <div style="display:none" id="csv">
        SepalLength,SepalWidth,PetalLength,PetalWidth,Name
        5.1,3.5,1.4,0.2,Iris-setosa
        4.9,3.0,1.4,0.2,Iris-setosa
        7.0,3.2,4.7,1.4,Iris-versicolor
        6.4,3.2,4.5,1.5,Iris-versicolor
        6.3,3.3,6.0,2.5,Iris-virginica
        5.8,2.7,5.1,1.9,Iris-virginica
    </div>
    <script src="http://threejs.org/build/three.min.js"></script>
    <script src="http://hip70890b.de/JsPlot3D/compiled/JsPlot3D.js"></script>
    <script>

        // place a canvas element inside the div with the id plot
        var plot = new JSPLOT3D.Plot(document.getElementById("plot"))

        // plot data into that canvas
        var data = document.getElementById("csv").innerHTML
        plot.plotCsvString(data, 0, 1, 2, {
            dataPointSize: 0.2,
            colorCol: 4,

            // optional, can be autodetected:
            labeled: true,
            header: true,
            separator: ","
        })

        // place the autogenerated legend somewhere
        plot.createLegend(document.getElementById("legend"))

    </script>
    <style>
        body {
            font-family: sans-serif;
        }

        .jsP3D_labelColor {
            width: 10px;
            height: 10px;
            display: inline-block;
            border-radius: 100%;
        }
    </style>


