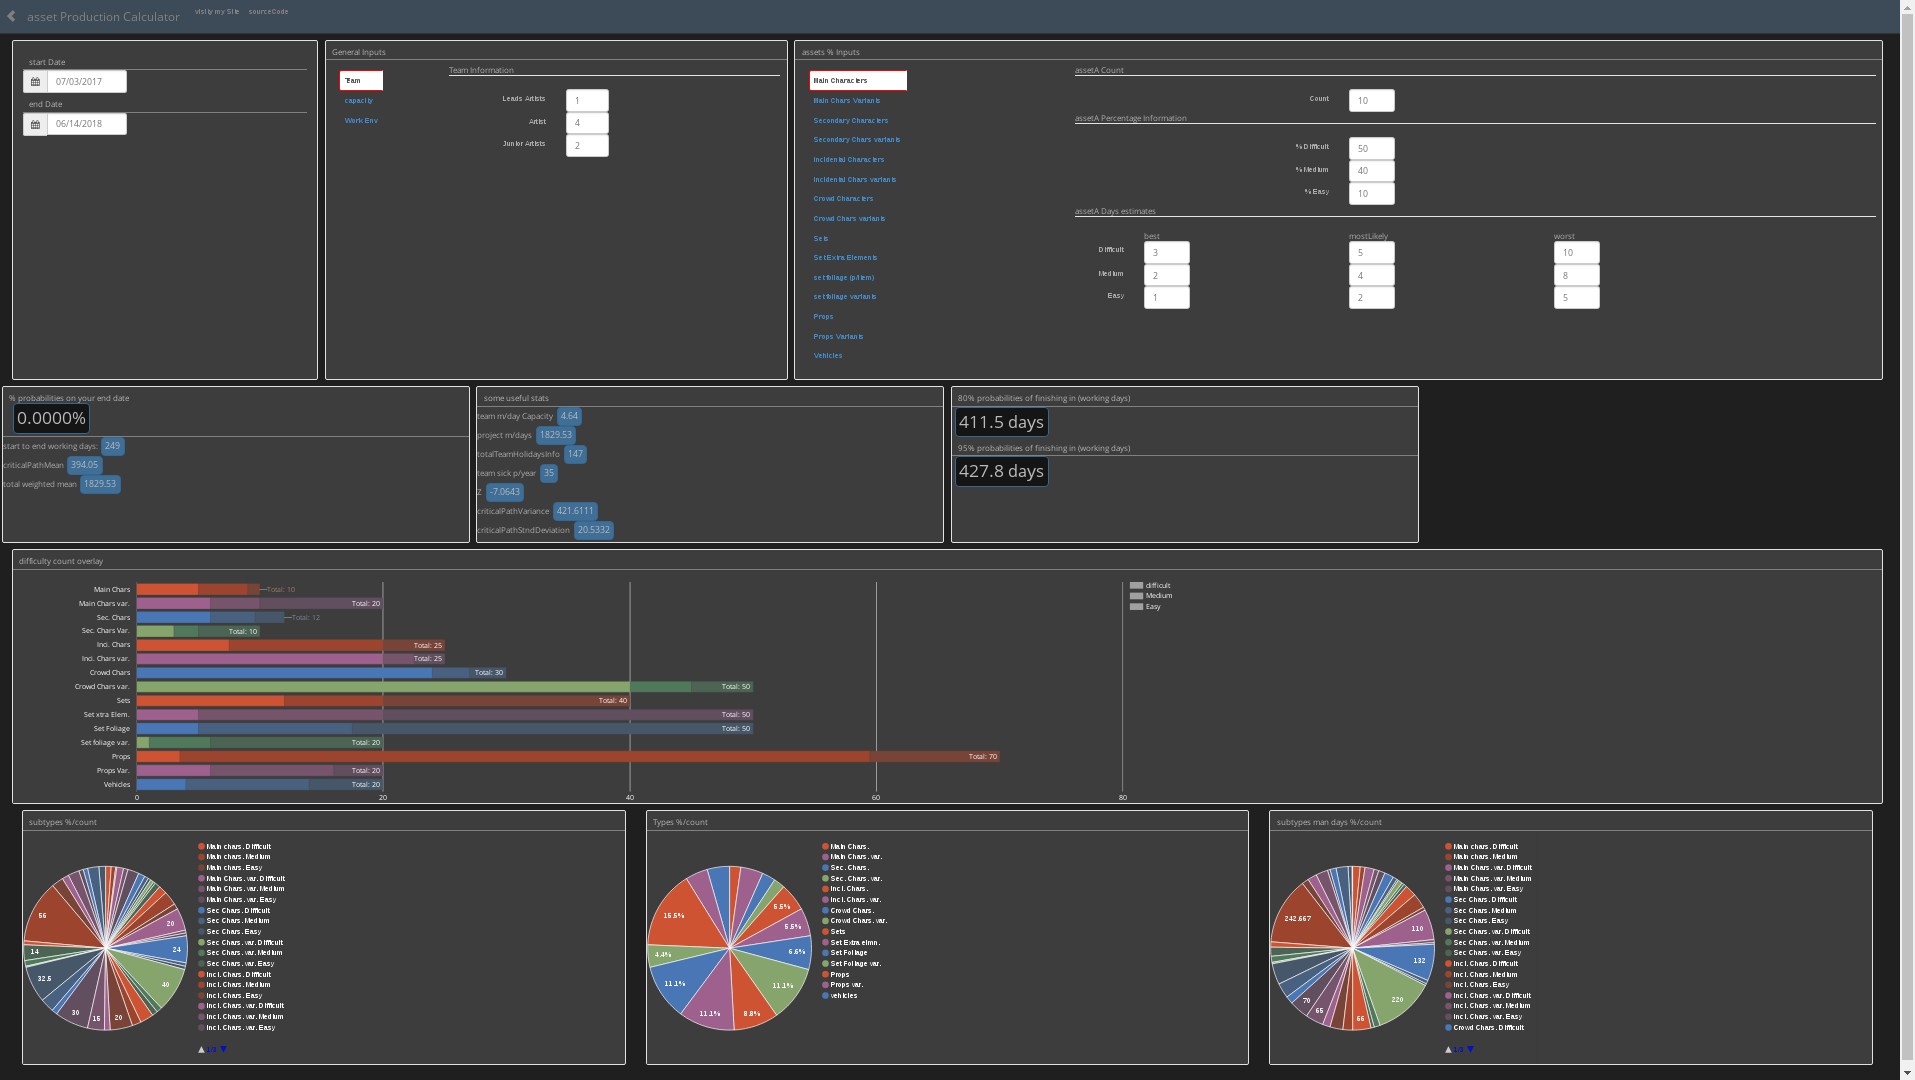
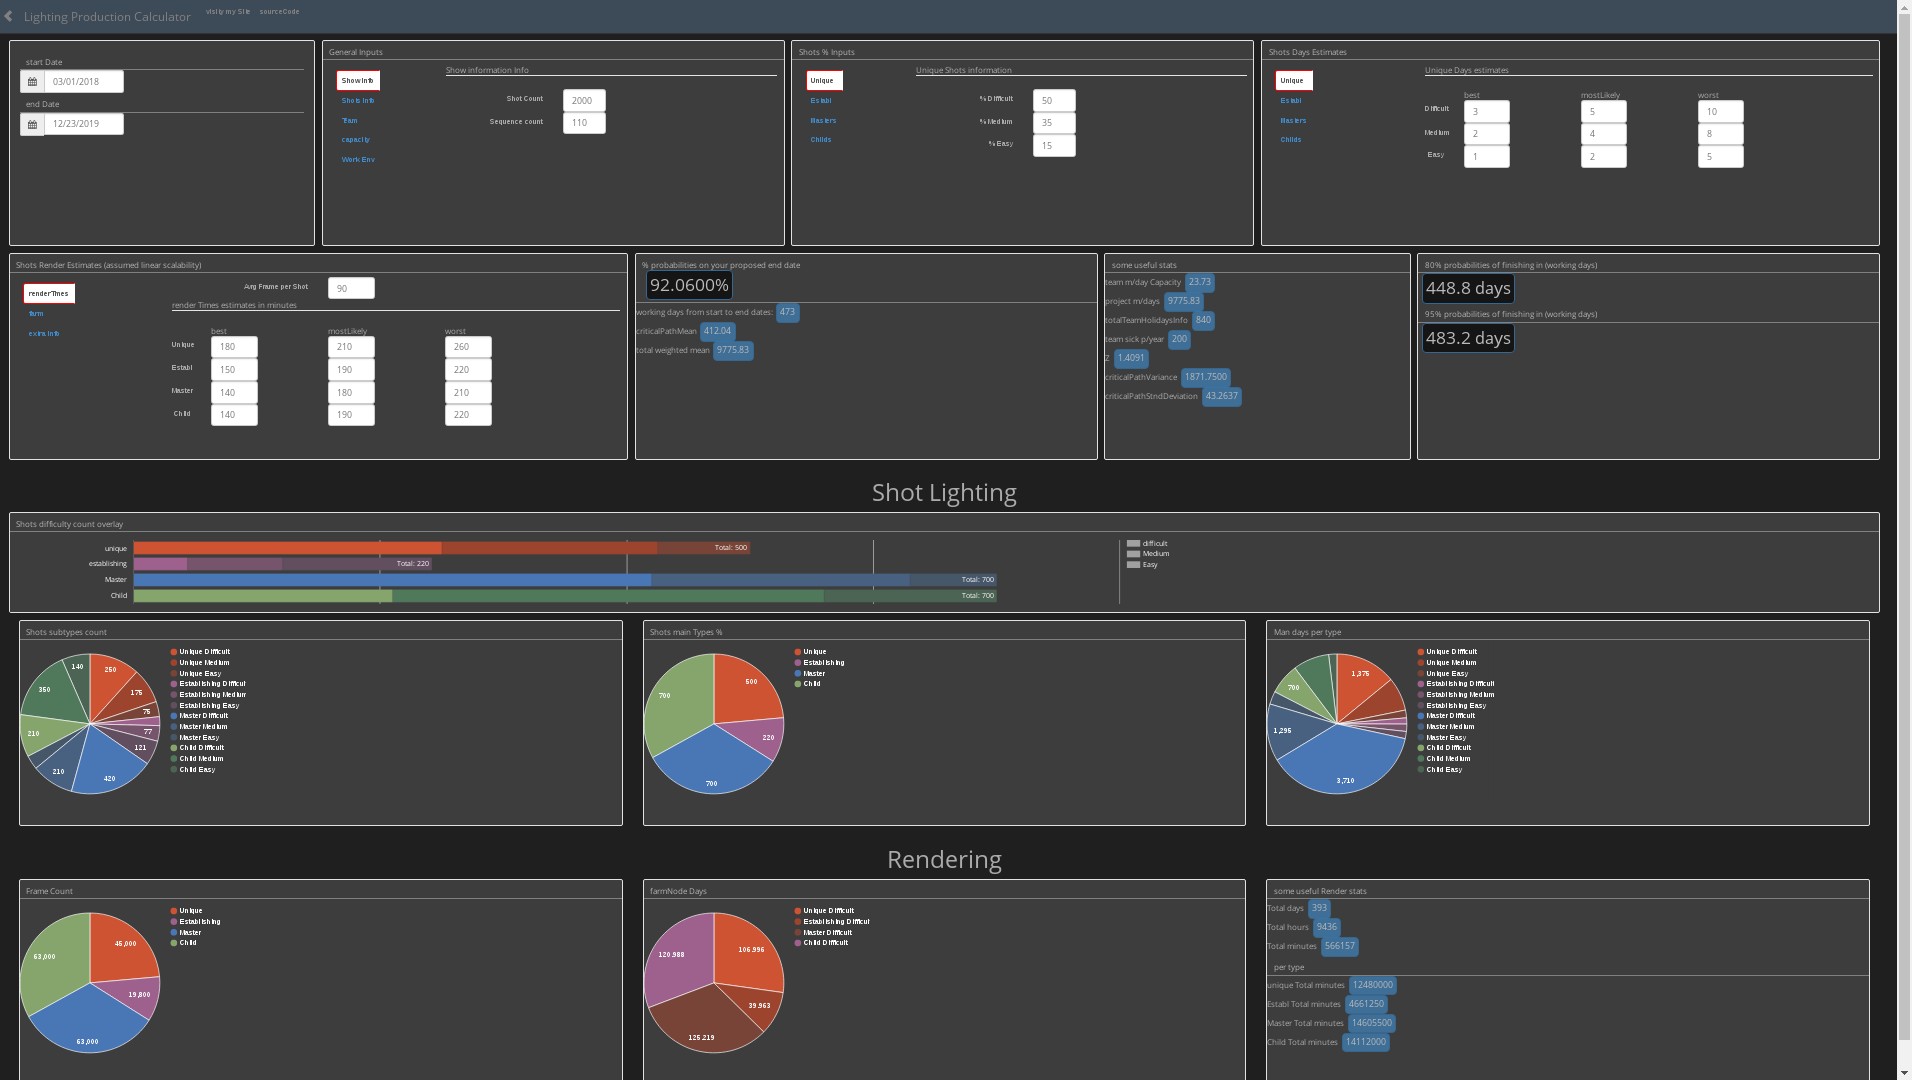
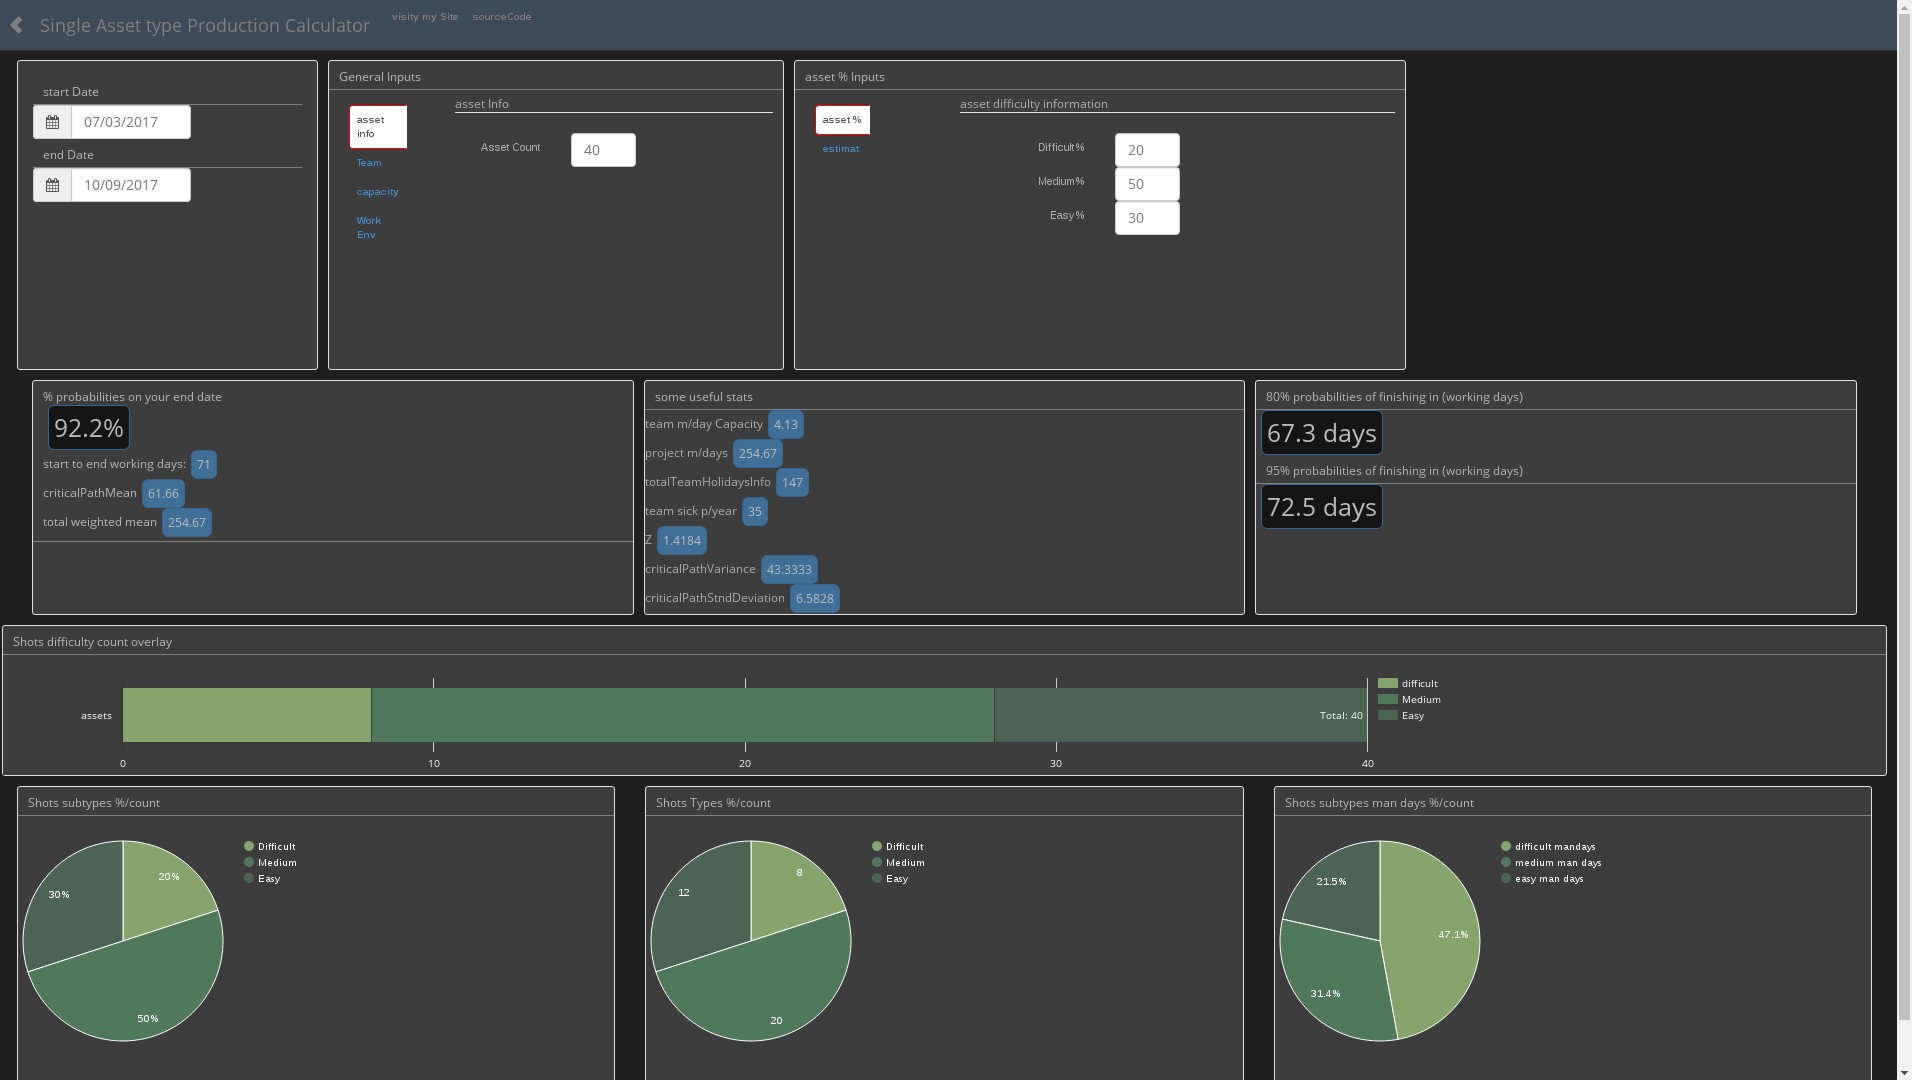
Pert based production calculators for CG productions with probabilities.
Built on Keen io, Keen Dashboard, Jquery, JS, JQuery, google charts, and d3.
Use Chrome browser until I figure out why the date calculator function is not working in firefox!
Browse through all the inputs boxes tabs (on the left) before entering your inputs. Get familiar with all the inputs required, lingo and definitions.
Please check the documenation down below.
Enter all your data about your team, working environment, holidays, asset types %, and best/mostLikely/worst estimates.
This will give you the 80% chances amount of working days required, and the 95% percent chances of success working days.
Notice that the date calculation ATM does not account for locale bank holidays, Christmas or similar religious breaks, etc.
See Limitations below in order to understand the calculator internals, what it does/how and more importanly what it doesn't do!
One of the big assumptions you need to be aware of if the risk of not having float, slack, lead or lag between tasks and having as many critical paths as artists.
This calculator assumes all the tasks are ready to start, and that the preproduction visual development is locked. So all tasks will be ready to kick off following the visuals.
Accounts for holidays, sick days, team leads/artists/juniors % capacity, busy idle time (file handling), and amount hours of daily reviews, on a per day basis.
It does not account for locale bank holidays, Christmas or similar religious breaks, etc.
Results are “work days duration”.
When using this, I know the scope and the team but we don't know the actual tasks and dependencies.
The calculator Assumes tasks are spread across artist equally, and there will be no float, slack, lead or lag between tasks.
Often enough this is true in lighting when the lighters are working on several shots at the same time, although might not be the case for other departments.
Use the busy/idle parameter to give tasks handover/waiting time, and avoid overworking the resources in a non realistic way (see Busy Idle time below).
Having all the artist with the same queue (aka: as many identical critical paths as artists) will decrease the % of probabilities of finishing on time, but this fact is omitted ATM as we can’t know tasks dependencies in advance. For a more detailed breakdown once you know the dependencies and exact % of difficult/med/easy move to Microsoft Project or similar!
http://ezequielm.com/lightingCalc/lightingCalc.html
http://ezequielm.com/lightingCalc/assetCalc.html
http://ezequielm.com/lightingCalc/singleAssetCalc.html
Wait Time = %busy / %idle (or b/(100-b) where b = % utilized)
Therefore, if the resource is 90% utilized then the wait time is 9x’s longer than if the person is 50% utilized.
Wait time is 11x’s longer when 99% utilized compared to when you where 90% utilized.
Refer to "the pheonix project", and queuing Theory.
This refers to the amount of actual work the artists will be able to do on a single day, due to other responsibilities or abilities.
By default Leads are accounted for 0.20 (20%) of their time as "working" compared to an Artist.
Artists as 100%. Junior artist at 60% of an Artist Capacity.
Then the daily amount of hours of team reviews and busy/idle time are discounted.
After that a % of holidays and sick days is removed from the team manday capacity according to the year working days, entitled holidays and average sick days taken by the artists.
Holidays are spread out equaly through the year (see To Do list), this is not realistic as most of the holidays happen during the summer time and locale religious holidays. Keep this is mind if your project duration is shorter than a full calendar year.
This should be an average of sickies pulled by artists on a single year. Similar to the team holidays, this number is spread equaly through the year.
HR should be able to give you this number.
- Take into account a biased % of holidays taken during the year according to the month.
By not averaging all holidays throughout the year, but having a per month % will give a better estimate. For ie: summer months and Christmas breaks are expected to have a bigger impact on the team capacity. - Investigate and expand on busy/idle % to avoid task queuing (ref: queueing theory, and the phoenix project)
- Add a % of non-overlapping to expand project duration more realistically.
The biggest limitation is not knowing the tasks dependencies in advance.
We should have an actual work breakdown structure, sequences, assets, etc to come up with this.
Currently the actual project Duration (aka: the critical path, or the minimum time needed for the project) will be driven by a guesstimate like below:
    Critical path mean=
    (assetDifficultMean(assetDifficultCount/teamCapacity)+
    (assetMediumMean(assetMediumCount/teamCapacity)+
    (assetEasyMean(assetEasyCount/teamCapacity)+


