-
Notifications
You must be signed in to change notification settings - Fork 2
Visualizing results
First you need to format similarity output in a form of 2D matrix. FormatOutput.java does it for you taking below arguments
argument 1 - path to CSV file to write the formatted similarity calc csv
argument 2 - Video pairs with similarity score
argument 3 - List of all videos
Sample command-
java -cp target/pooled-time-series-1.0-SNAPSHOT-jar-with-dependencies.jar org.pooledtimeseries.FormatOutput path/to/output/matrix/ path/to/similarity/pair path/to/video-names
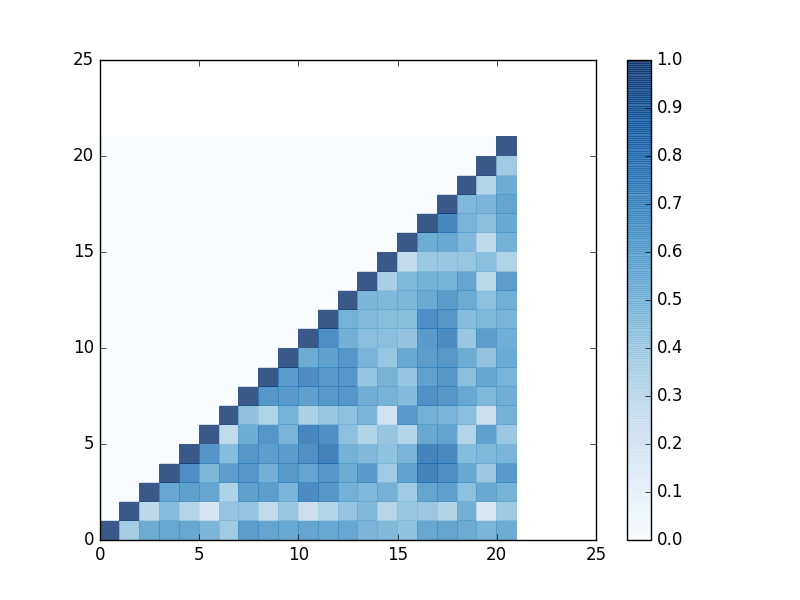
After this you can use similarity_heatmap.py to generate a heatmap image. It requires numpy and pylab python libraries and take below arguments -
argument 1 - path to formatted similarity 2D matrix csv file
argument 2 - number of videos
Sample command-
cd visualization/py
python similarity_heatmap.py path/to/similarity/matrix/ 100
Results are stored in visualization/data/similarity_heatmap.png. Sample heatmap -

If you want to see D3 heatmap you can copy similarity matrix to visualization/data/formatted_similarity_calc.csv and open visualization/index.html in any browser. You will have serve it through a HTTP server. For testing purpose python SimpleHTTPServer works well.