-
Notifications
You must be signed in to change notification settings - Fork 20
Make usage of Grafana Provisioning feature
It’s possible to manage the connection configuration for multiple IBM Storage Scale clusters (data sources) in Grafana by adding a YAML config file in the provisioning/datasources directory. Follow reading Provision an IBM Storage Scale data source to manage the connection configuration of multiple IBM Storage Scale clusters running on bare metal in Grafana.
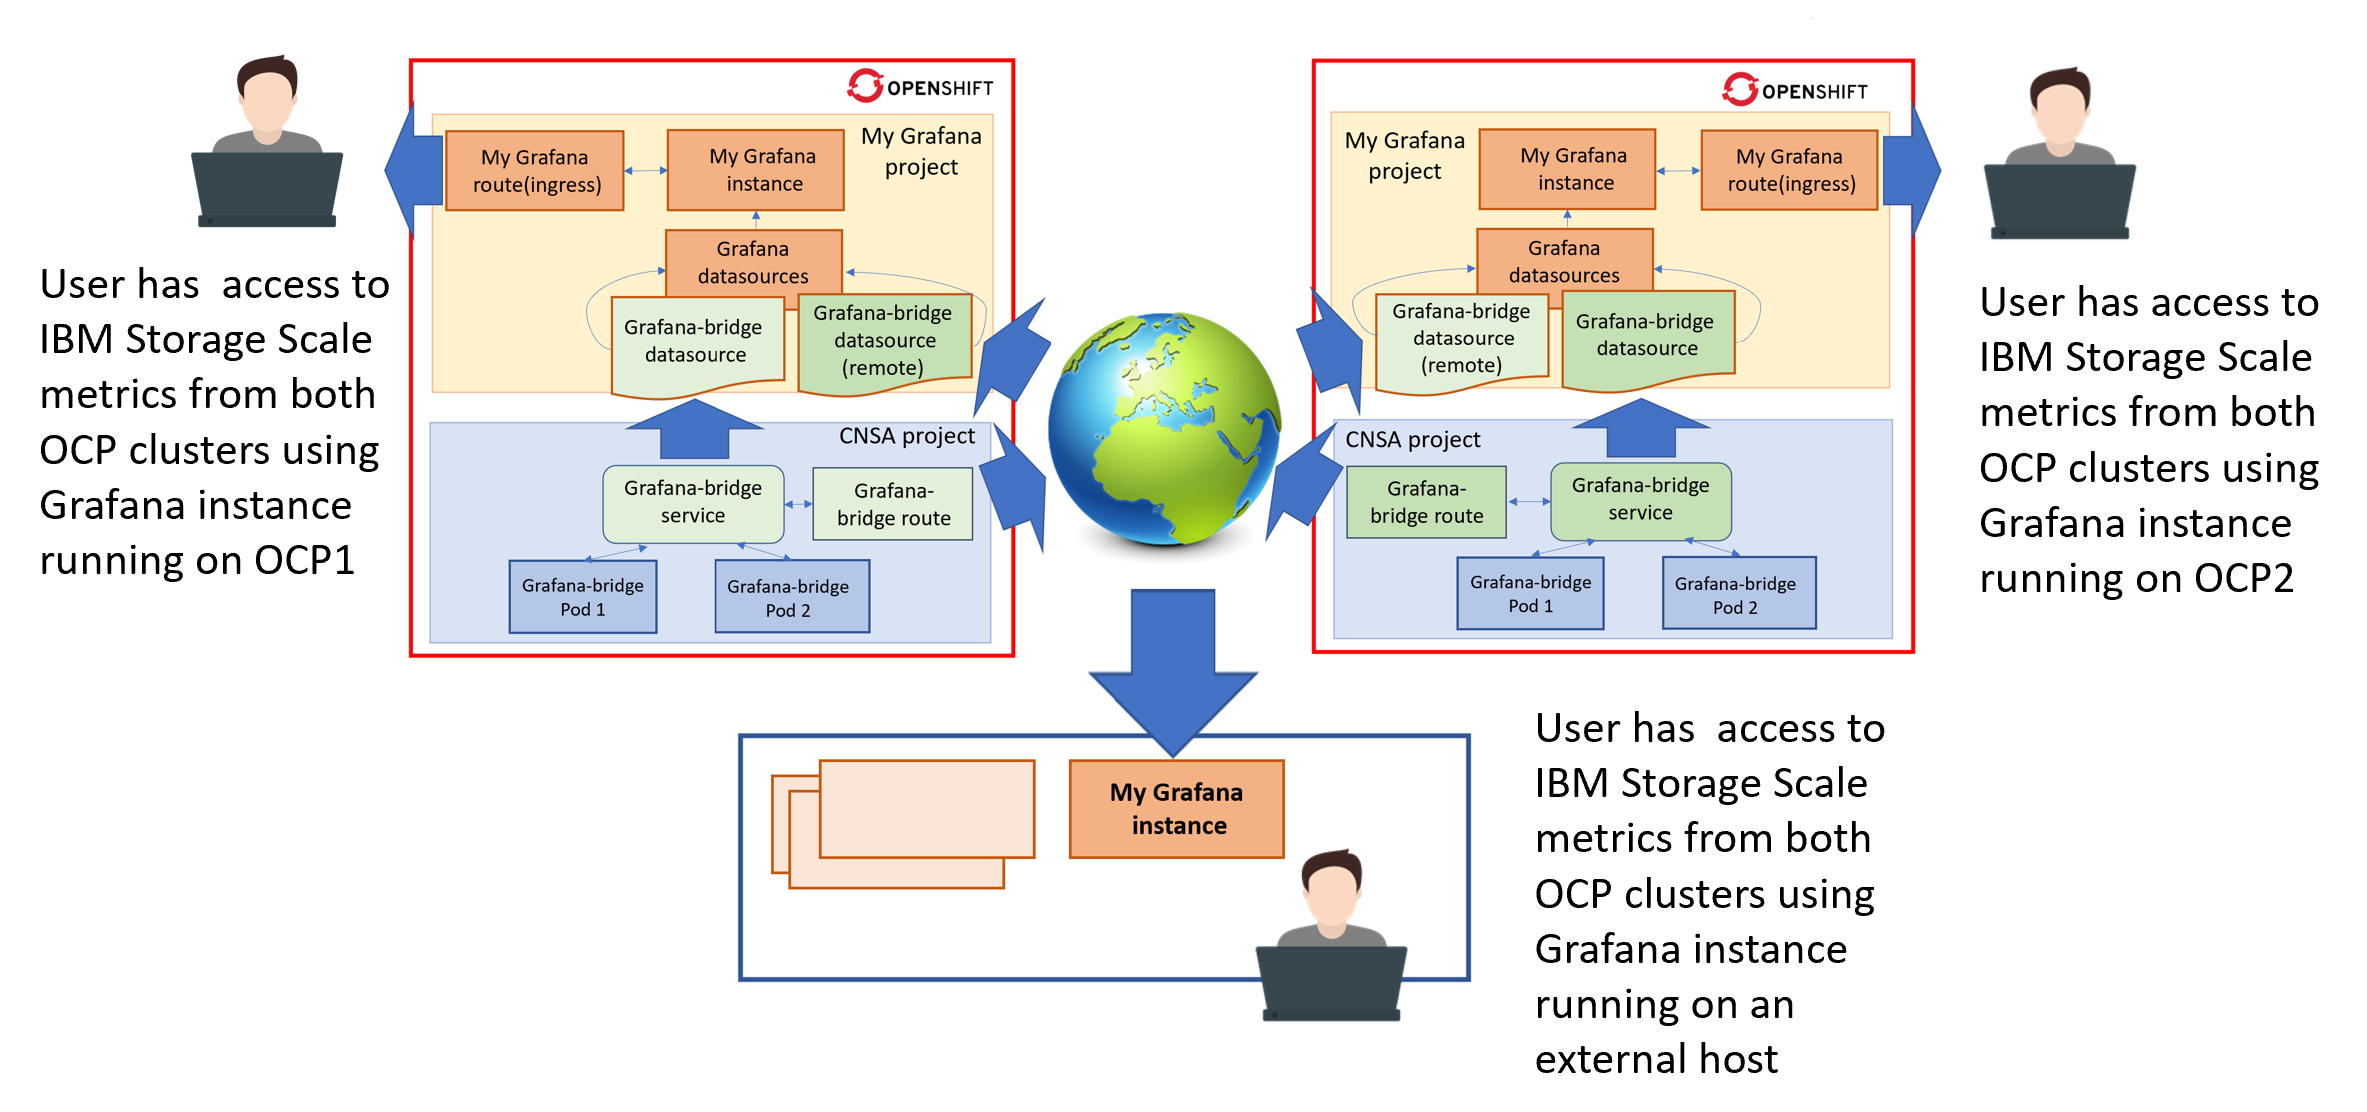
In a cloud environment, data source provisioning can be performed by deploying DataSource CR maintained by RedHat Grafana-Operator. Starting with version 5, Redhat Grafana Operator supports [the management of cross-namespace data sources instances] (https://grafana-operator.github.io/grafana-operator/docs/examples/crossnamespace/readme/). This new feature provides the ability to monitor with a single Grafana instance multiple systems running in a cloud environment. An example of usage such such feature might be the CNSA AFM regional DR setup.

The same configuration opportunities can be used for a MIXED environment.

The placement and number of managed Grafana instances in each particular environment depends on the business strategy 1. Centralized or distributed monitoring 2. Grafana instance running in a container environment or running externally
The following example shows how to connect a grafana-bridge running in remote Openshift cluster to a Grafana instance:
A route to the grafana-bridge service path must be deployed to enable external access to grafana-bridge.
kind: Route
apiVersion: route.openshift.io/v1
metadata:
  name: grafanabridge
  namespace: ibm-spectrum-scale
  labels:
    app.kubernetes.io/instance: ibm-spectrum-scale
    app.kubernetes.io/name: grafanabridge
  annotations:
    openshift.io/balance: source
spec:
  to:
    kind: Service
    name: ibm-spectrum-scale-grafana-bridge
    weight: 100
  port:
    targetPort: https
  tls:
    termination: passthrough
In a different OpenShift cluster deploy a Grafana kind resource.
Grafana instance requires ssl connection data to communicate with a grafana-bridge. With Grafana Operator V.5 it is possible to apply ssl/tls connection data during datasource connection dynamically from a tls secret.
Create a kind secret for storing the ssl cerificate and key from grafana-bridge running in remote OpenShift cluster.
apiVersion: v1
data:
  tls.crt: ''
  tls.key: ''
kind: Secret
metadata:
  name: grafana-bridge-tls-cert-remote
type: kubernetes.io/tls
From OpenShift cluster where grafana-bridge is running, copy and temporarily save the grafana-bridge SSL connection data stored in the ibm-spectrum-scale-grafana-bridge-service-cert secret.
TLS_CERT=`oc get secret ibm-spectrum-scale-grafana-bridge-service-cert -n ibm-spectrum-scale -o json |jq '.data["tls.crt"]' | tr -d \"`

TLS_KEY=`oc get secret ibm-spectrum-scale-grafana-bridge-service-cert -n ibm-spectrum-scale -o json |jq '.data["tls.key"]' | tr -d \"`
Update the grafana-bridge-tls-cert-remote secret with TLS_CERT and TLS_KEY variables content.
oc get secrets grafana-bridge-tls-cert-remote -n $NAMESPACE -o json | jq ".data[\"tls.key\"] |= \"$TLS_KEY\"" | jq ".data[\"tls.crt\"] |= \"$TLS_CERT\""| oc apply -f -
Create a GrafanaDatasource kind object with a reference to the grafana-bridge-tls-cert-remote secret and the grafana-bridge route url.
apiVersion: grafana.integreatly.org/v1beta1
kind: GrafanaDatasource
metadata:
  name: bridge-grafanadatasource-remote
spec:
  valuesFrom:
  - targetPath: "secureJsonData.tlsClientCert"
    valueFrom:
      secretKeyRef:
        key: "tls.crt"
        name: "grafana-bridge-tls-cert-remote"
  - targetPath: "secureJsonData.tlsClientKey"
    valueFrom:
      secretKeyRef:
        key: "tls.key"
        name: "grafana-bridge-tls-cert-remote"
  datasource:
    access: proxy
    editable: true
    isDefault: true
    jsonData:
      httpHeaderName1: Authorization
      timeInterval: 5s
      tlsAuth: true
      tlsSkipVerify: true
      tsdbVersion: '2.3'
    name: grafana-bridge-remote
    secureJsonData:
      tlsClientCert: ${tls.crt}
      tlsClientKey: ${tls.key}
    type: opentsdb
    url: < grafana-bridge service route url >
  instanceSelector:
    matchLabels:
      dashboards: my-dashboards
Visit the IBM Storage Scale Knowledge Center for getting more info about the latest product updates
-
- Setup classic Grafana
- Make usage of Grafana Provisioning feature
-
- Installing RedHat community-powered Grafana operator from OperatorHub
- Creating Grafana instance using the RedHat community-powered Grafana-operator
- Creating Grafana Datasorce instance from Custom Resource managed by the RedHat community powered Grafana operator
- Importing the predefined dashboard from the example dashboards collection
- Exploring Grafana WEB interface for CNSA project in a k8s OCP environment
- How to setup Grafana instance to monitor multiple IBM Storage Scale clusters running in a cloud or mixed environment
- API key authentication
- Configurable bridge settings
- CherryPy builtin HTTP server settings
- How to setup HTTPS(SSL) connection
- Start and stop grafana-bridge with systemd