-
Notifications
You must be signed in to change notification settings - Fork 20
Home
Welcome to the IBM Storage Scale Bridge for Grafana Wiki!
The IBM Storage Scale Bridge for Grafana (grafana-bridge) can be used to retrieve and process IBM Storage Scale performance data with third party applications. One of the most popular use cases is to explore IBM Storage Scale performance data in a web-based graphical interface, such as Grafana dashboards. Another use case is to export IBM Storage Scale performance data to the Prometheus database for further analytical processing and long-term storage of the collected data.
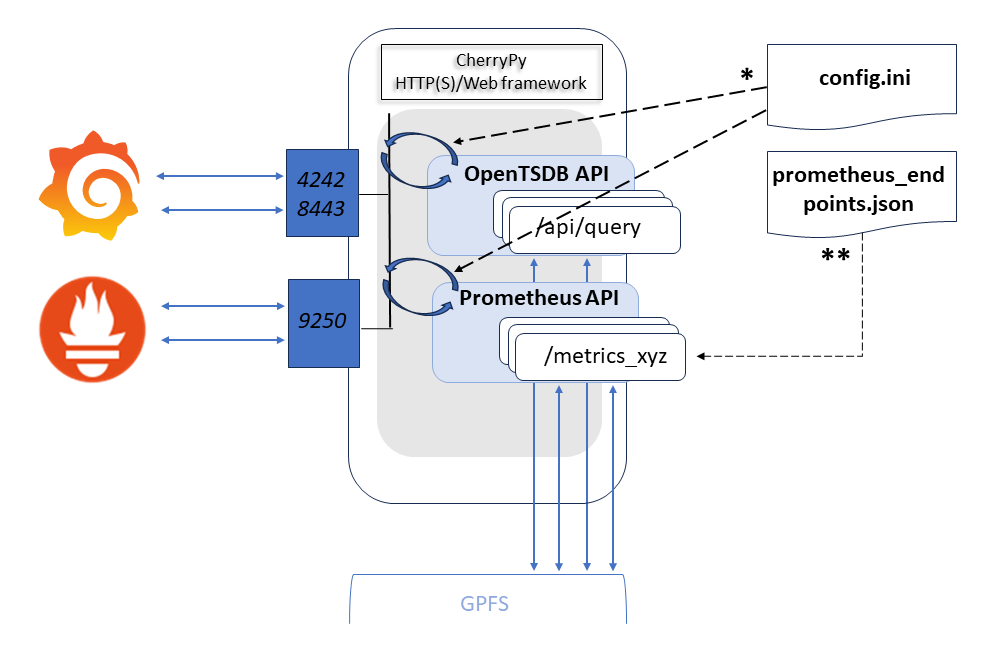
Grafana-bridge is a stand alone Python application that uses a CherryPy server to exchange data via HTTP/HTTPS between a client (third-party application) and a server (IBM Storage Scale System). It translates the IBM Storage Scale metadata and performance data collected by the IBM Storage Scale Performance Monitoring Tool (ZiMon) into the queries accepted by registered third-party applications. The communication between grafana-bridge and the external application takes place via separate plug-ins. The individual plug-ins are enabled using the information in the config.ini configuration file.

* - The communication port must be specified (commented in) in the config.ini file for each plug-in to be activated.
** - The Prometheus endpoints are managed via a JSON file and dynamically registered at startup if the Prometheus API plug-in is enabled.
Visit the IBM Storage Scale Knowledge Center for getting more info about the latest product updates
-
- Setup classic Grafana
- Make usage of Grafana Provisioning feature
-
- Installing RedHat community-powered Grafana operator from OperatorHub
- Creating Grafana instance using the RedHat community-powered Grafana-operator
- Creating Grafana Datasorce instance from Custom Resource managed by the RedHat community powered Grafana operator
- Importing the predefined dashboard from the example dashboards collection
- Exploring Grafana WEB interface for CNSA project in a k8s OCP environment
- How to setup Grafana instance to monitor multiple IBM Storage Scale clusters running in a cloud or mixed environment
- API key authentication
- Configurable bridge settings
- CherryPy builtin HTTP server settings
- How to setup HTTPS(SSL) connection
- Start and stop grafana-bridge with systemd