-
-
Notifications
You must be signed in to change notification settings - Fork 14
Tutorial
Here we provide two examples measured with a ZEISS LSM780 / Confocor3 microscope:
Tutorial files (right click - save as...):
A simple calibration of the focal volume using a dilute concentration of a synthetic dye (AlexaFluor™488) in aqueous solution (10 mM Tris/HCl, pH 8). We recorded a single run of 120 sec at three different positions in the sample well. Each of these measurements were saved separately (001-003_A488). We used a 50/50 beam splitter to distribute the signal into two autocorrelation channels (AC1 and AC2) with identical filter settings. Cross-correlation of these signals is a common way to remove dominant after pulsing at short correlation times (CC12 and CC21). In summary, loading the calibration data set into PyCorrFit results in 3 measurements x 1 run x 4 channels = 12 correlation curves which appear as separate pages.
For fitting we chose the T-3D model to account for triplet (since it arises from the same molecules it appears in both auto- and cross-correlation) and a single diffusion species in solution. After loading, we used the tool "Data range" to remove the first 2 time bins containing mainly after pulsing and "applied to all pages". Then we fitted the curves via "Batch control". In "Statistics view" we obtained the average triplet time (2.3 µs) which was fixed (unchecked) in a second round of fitting. From the diffusion time (26,4 ± 0.9 µs) and the structure parameter SP one can calculate the focal volume Veff (see Help/documentation). The session was finally saved as Alexa488-calibration.pcfs.

Tutorial files (right click - save as...):
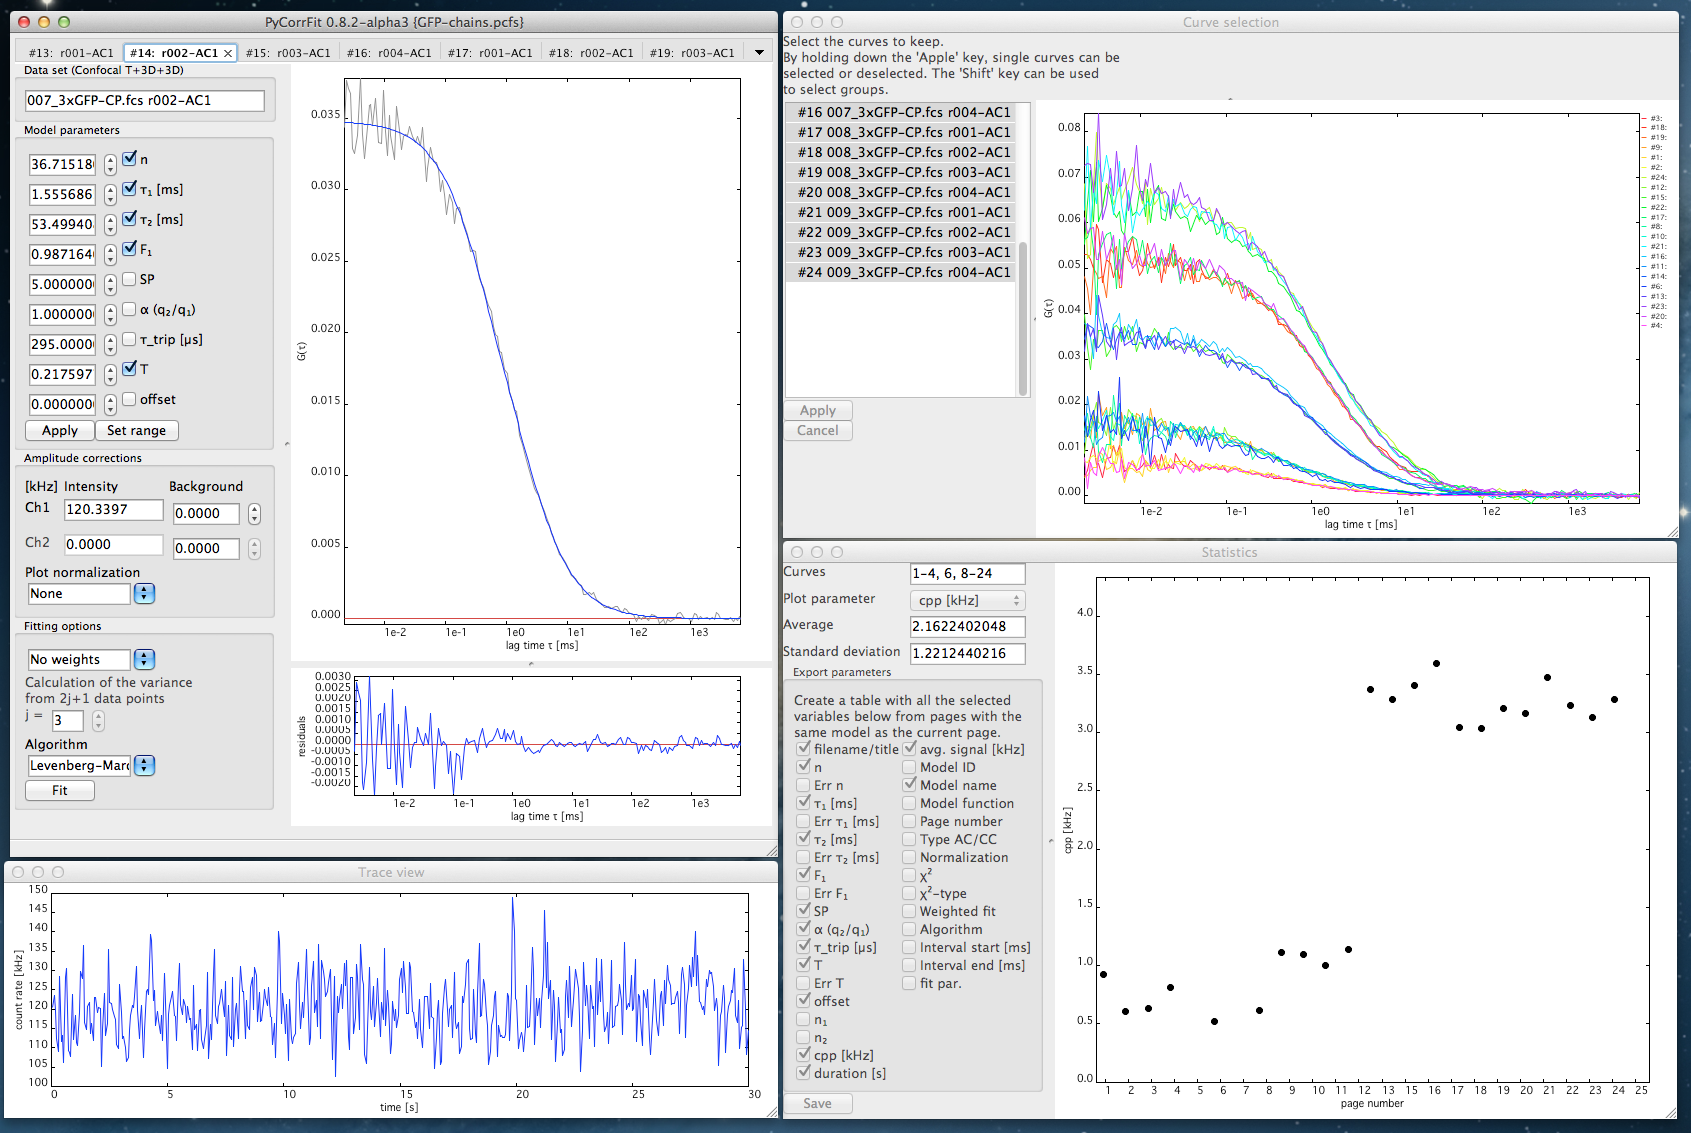
A monomeric eGFP (1xGFP) or a chain of three eGFP domains (3xGFP) were expressed in HEK293T cells and their diffusion was measured in the cytoplasm. We measured three cells for each construct (004-006_1xGFP and 007-009_3xGFP) at one position in the cytoplasm, where we recorded 4 times 30 second runs. Again, the 50/50 beam splitter was used. Nonetheless, while loading, we selected only for AC1 a T-3D-3D model, thereby restricting the evaluation to this channel. Loading produced 2 constructs x 3 cells x 4 runs = 24 pages.
Visual inspection of the curves and traces suggested to remove pages #5 and #7. Due to noise at short correlation times, the data range was chosen 10-183. For fitting we checked the triplet parameters for variation to cover GFP blinking. The average value for the blinking related correlation time (295 µs) is in good agreement with literature and was fixed in subsequent rounds of fitting. Cellular data are heterogenous. Some curves contain slow fluctuations related to global movements of organelles. In those cases a second diffusive component was introduced. Calculating the average diffusion time with the statistics view panel (enter page numbers into the window "Curves") revealed for the 1xGFP construct (pages #1-12) a short component with taudiff = 1.1 ± 0.2 ms and for the 3xGFP construct (#13-24) taudiff = 1.9 ± 0.4 ms. Thus the two differently sized constructs can be resolved. A distinction between one and three GFPs per molecule is even more significant when looking at the counts per particle (CPP) of all pages (#1-4,6,8-24) in the Statistics view. The session was finally saved as GFP-chains.pcfs.
