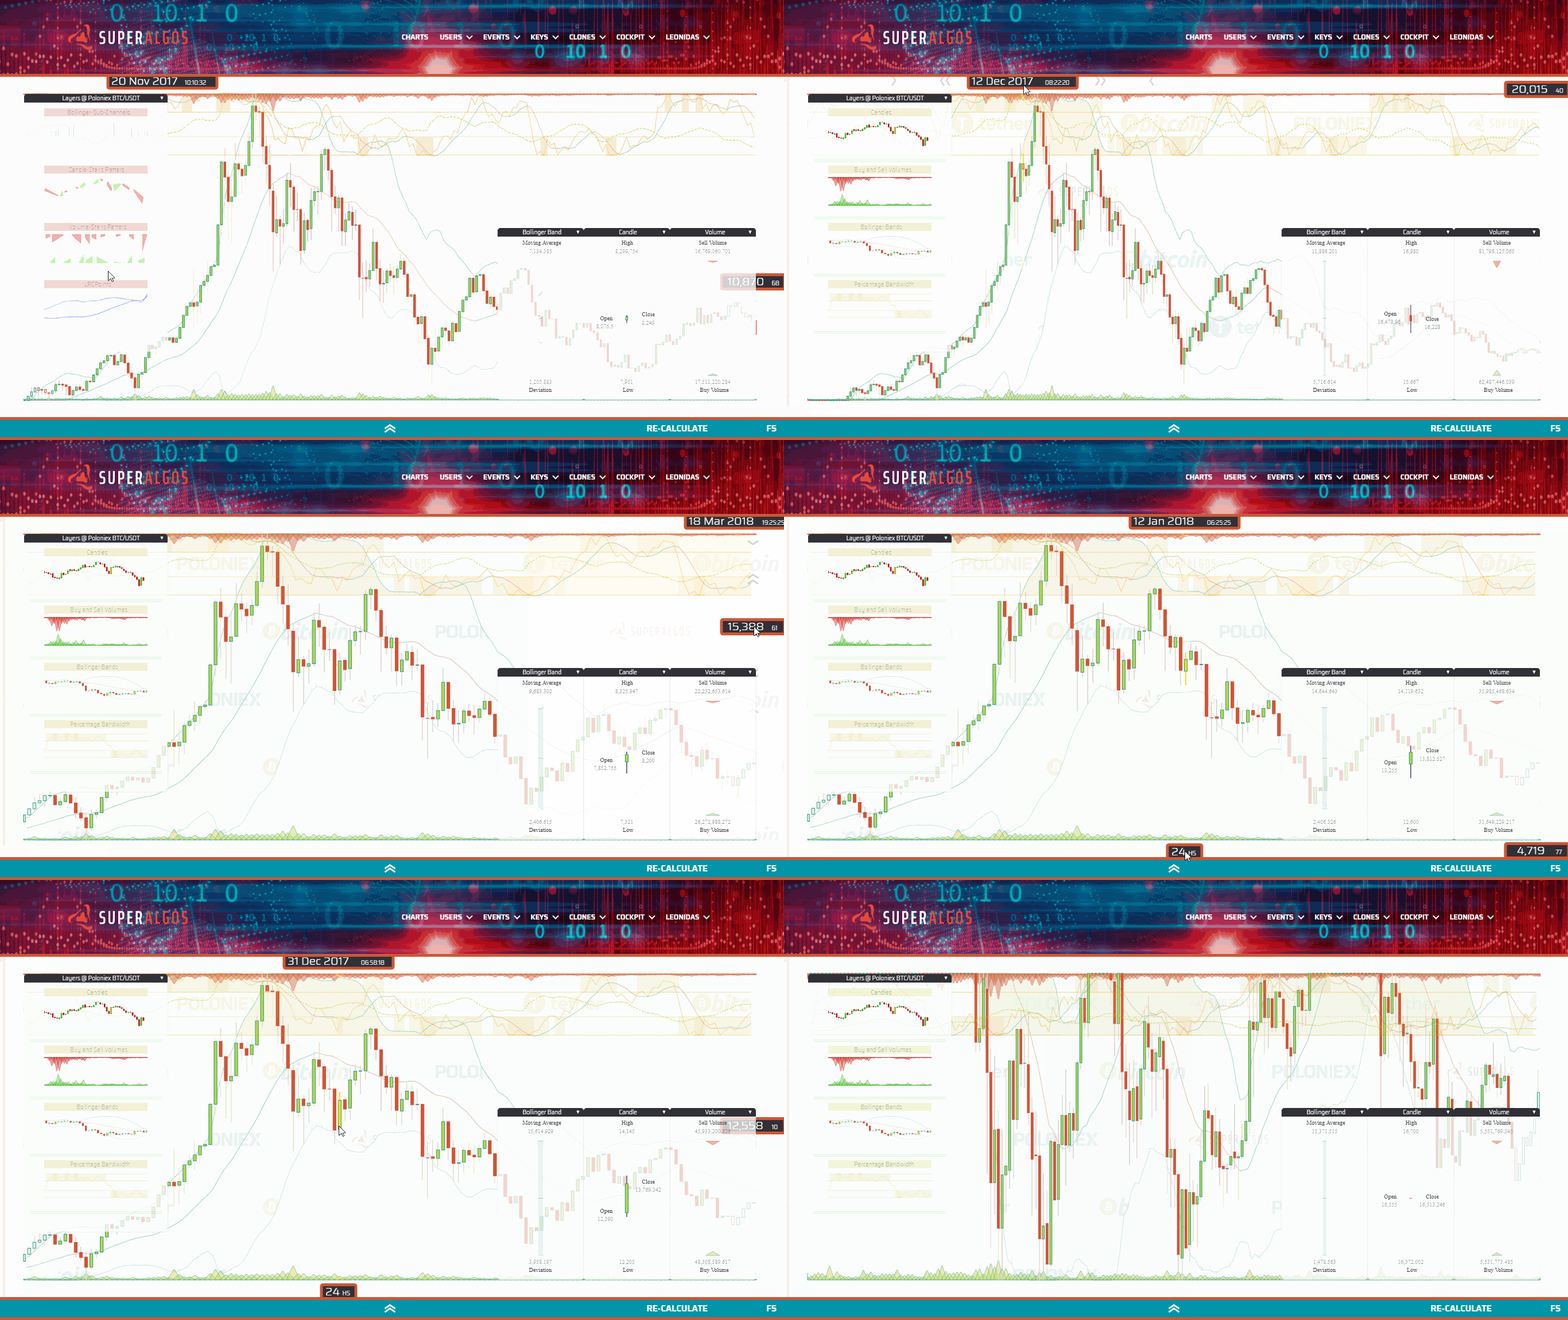
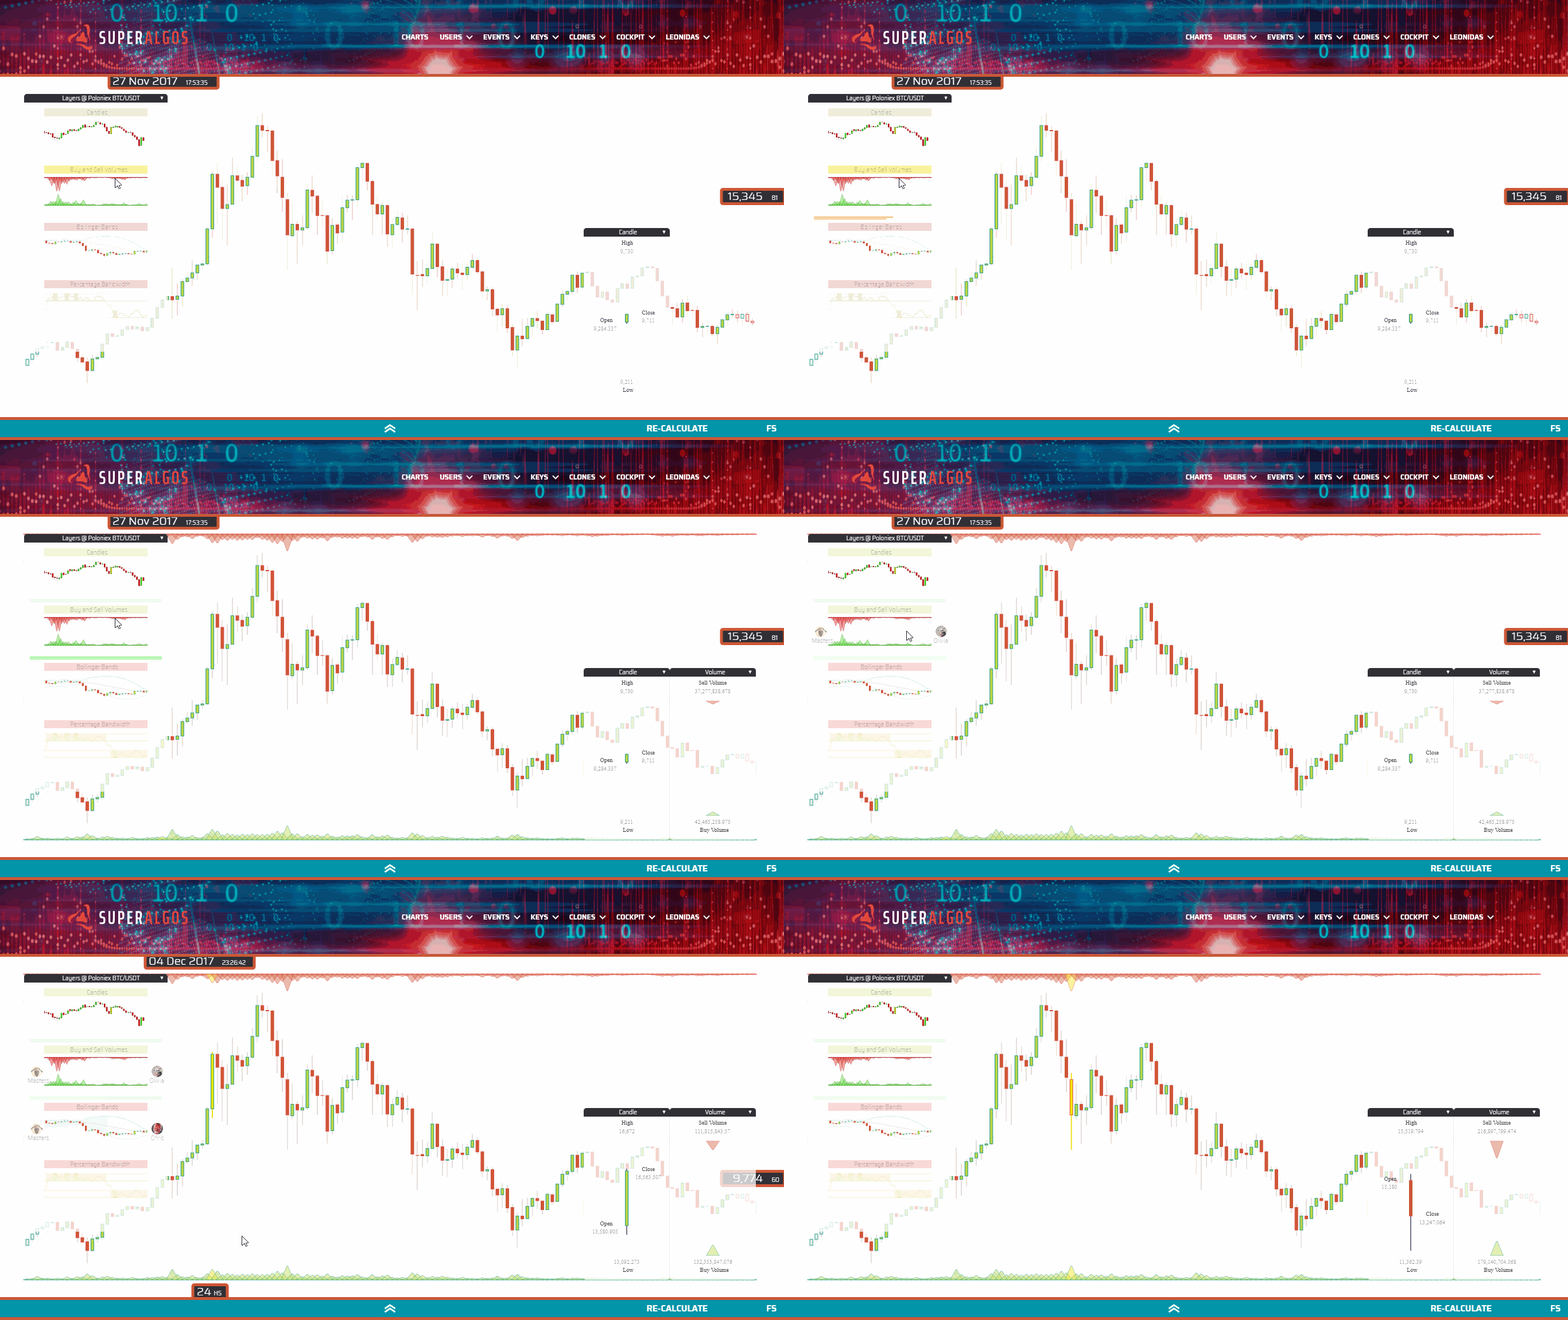
The Canvas App provides a visual environment for the Charting System and the Strategy Designer.
Installation (for developers): To install the Canvas App, you need to install AAWeb, following this guide.
Use the latest Chrome version to access the Demo (to become available soon), sign up, log in and click on the CHARTS link in the Menu.
The first time you access the Charts, you will see the following screen, split in half. The top half features the space used by the Charting System and the bottom half features the Strategy Designer.
Use the control in the center of the turquoise bar to pull the bar up and down in order to make more room to either application.

Pulling the bar to the very top of the screen causes the Charting System to stop consuming resources in your local machine, and gives you an ample view of the Strategy Designer.
The Strategy Designer allows you to manage your Trading System. The structure represented by the various icons nested in a hierarchy of elements is the representation of the logic behind your Strategies.

Pulling the bar to the very bottom of the screen causes the Strategy Designer to stop consuming resources from your local machine, and offers a full-screen view of the Charting System.
The Charting System plots indicators data along with the actions taken by the Strategy Engine and the Executor, integrated with market data.
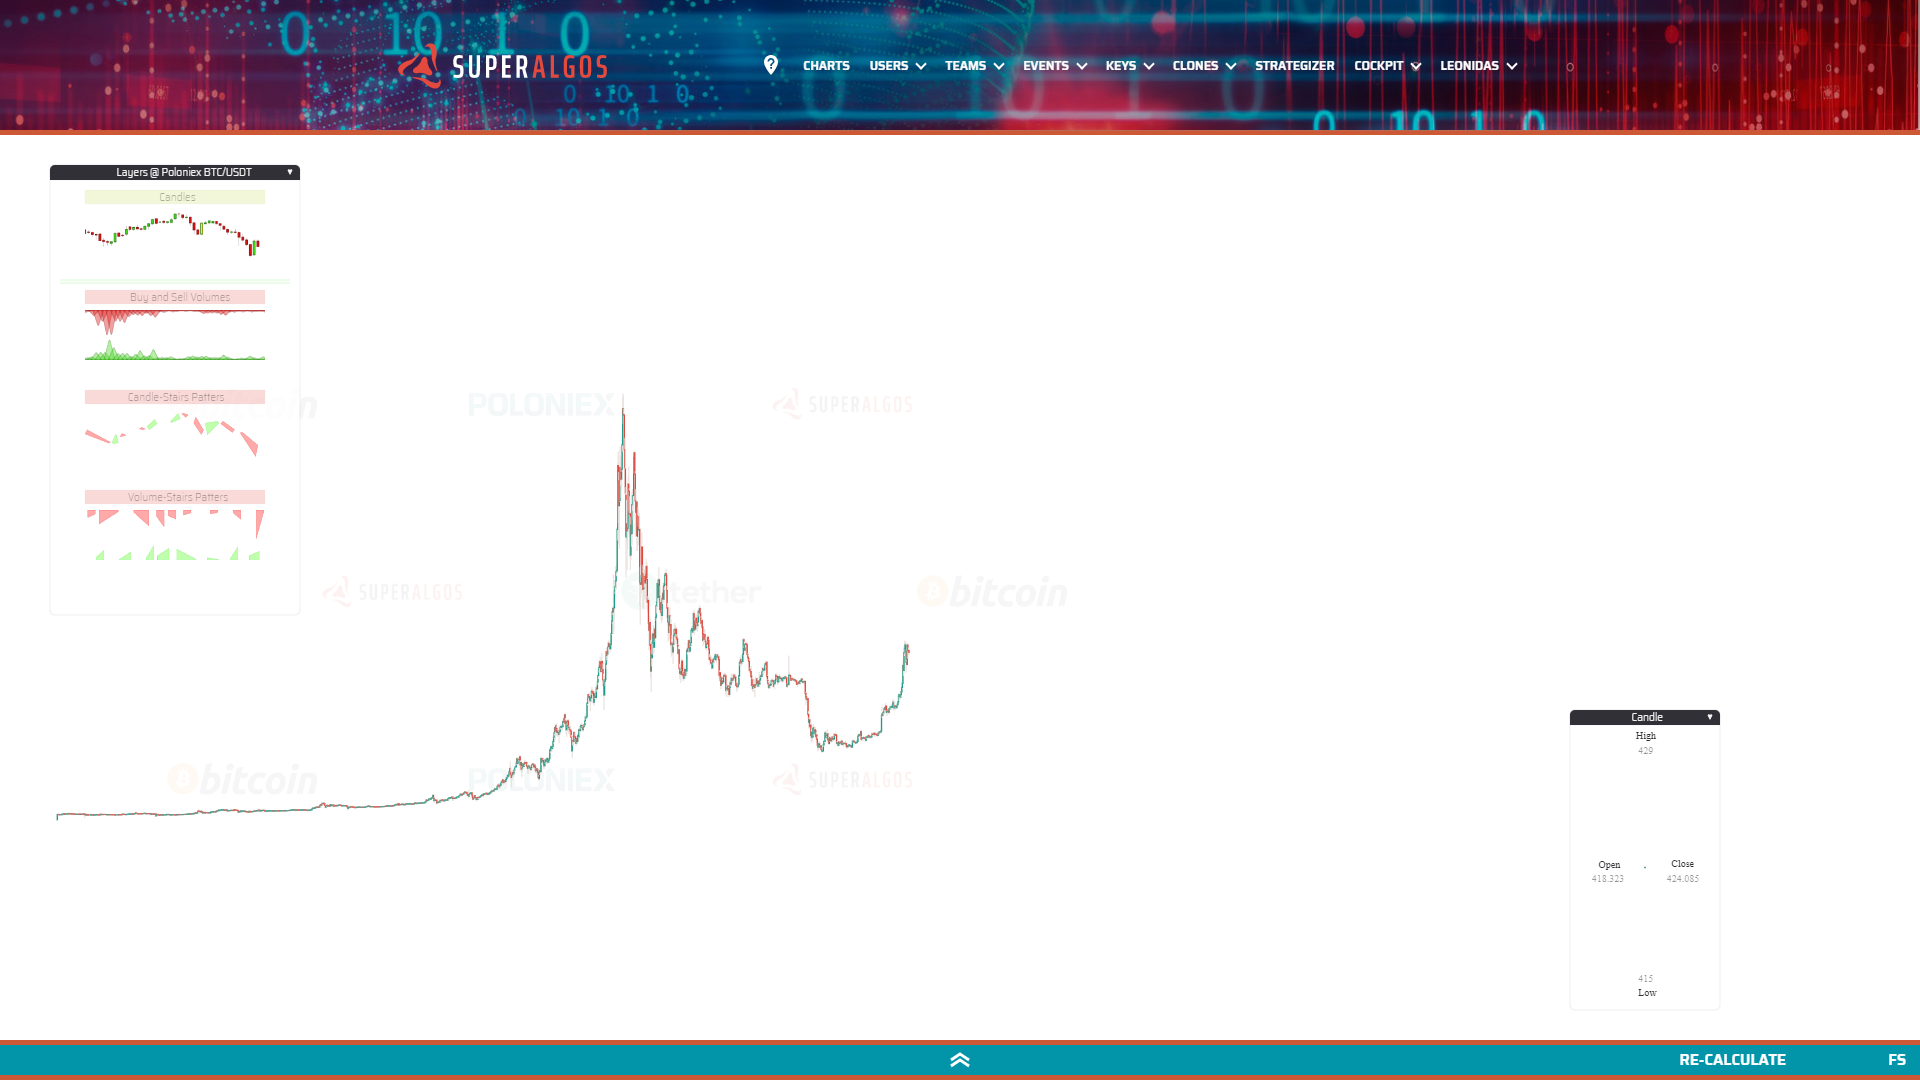
The Superalgos Protocol (also refered to as the protocol) determines the structure in which all the information regarding a trading system is stored and—at the same time—provides a clear guidance on how traders using the various tools developed and distributed by the Superalgos Project shall create and automate their strategies.
You don't really need to know this, but for the sake of context...
The Strategy Engine backtests and forward tests the instructions defined on its protocol file input. In coordination with the Strategy Executor, the engine can also live trade.
The Strategy Executor interprets the execution instructions embedded at a protocol file. The instructions determine the type of order to use, and what to do in every possible situation that could emerge during the placement and management of exchange orders.
This panel includes different layers you may visualize by toggling them on and off with a single mouse clicks. The layer title bar can have 3 possible background colors:
- Red: layer is off.
- Green: layer is on.
- Yellow: layer is loading. If it stays yellow, it means it can't load fully.
Notice the following three elements relative to the position of the mouse pointer:
- Above, the current datetime. This is the date and time at the mouse pointer position.
- To the right, the current rate. This is the rate (in this case USDT per BTC) at the mouse pointer position.
- Below, the current time period (or candle size if you wish). This is the currently displayed time period—not only for candles, but for any other object plotted across available layers.
There are many things you can do with your mouse wheel.
- Scroll over the Layers Panel to access layers that may be out of reach downwards.
- Scroll on top of or next to the datetime to produce a horizontal scaling.
- Scroll on top of or next to the displayed rate to produce a vertical scaling.
- Scroll on top of or next to the time period to change the time period to available values.
- Scroll elsewhere over the chart to zoom in and out. The App will not only zoom in and out of the chart, but also automatically adjust the time period to the most convenient one (for the current zoom level).
To minimize a panel, click on the small triangle on the right of their title bar. This will automatically position the panel at the bottom of the screen. Clicking again restores the panel to its previous position.
You may also drag and drop the panels by right-clicking on the title bar.
Superalgos is an open system, meaning anyone can build layers for the Charting System. So far—with our current limited manpower—we have created 8 public layers (available without logging in) and 2 private layers (available to logged-in users):
- Candles: Typical candlesticks.

2. Volumes: I innovated a bit placing the buy volume at the bottom (in green), and the sell volume at the top (in red).
- Candle Stairs Patterns: This is an unusual pattern proving any dataset may be plotted on the charts (and by extension, that anything can be added to the system). A Stair Pattern is defined as a set of candles going in the same direction, either up or down. You can think of these patterns as "Candle Channels", as they represent channels with an up or down direction based on underlying candles direction.

4. Volume Stairs Patterns: A similar concept, this time with volumes. Whenever a sequence of volume bars is found where each one is bigger than the previous one, they are bundled together in a "Stair". The same applies when they are going down (the next is smaller than the previous one). For a trading bot, this serves to identify if sell or buy volumes are raising or declining, if any.

5. Bollinger Bands: This is the traditional Bollinger Bands indicator. Bollinger Bands have a moving average, in our case calculated with the last 20 periods (the line in the middle of the bands). We are plotting the moving average with one color when it is going up, and with a different color when it's going down. The upper band is at 2 Standard Deviations from the center, pretty much like the lower band, also at 2 Standard Deviations. These are the most widely used Bollinger Bands settings.

6. Percentage Bandwidth or %B: This is a well-known indicator that derives from the Bollinger Bands. In a nutshell it tells you how close the price is either to the upper band or the lower band at any point in time. When the price is in the middle of the bands (it is calculated with the close value of each candle), then %B is in the middle of its chart, at value 50. When the price touches the upper band, then %B is at 100, and finally when the price is at the lower band, then %B is at 0.
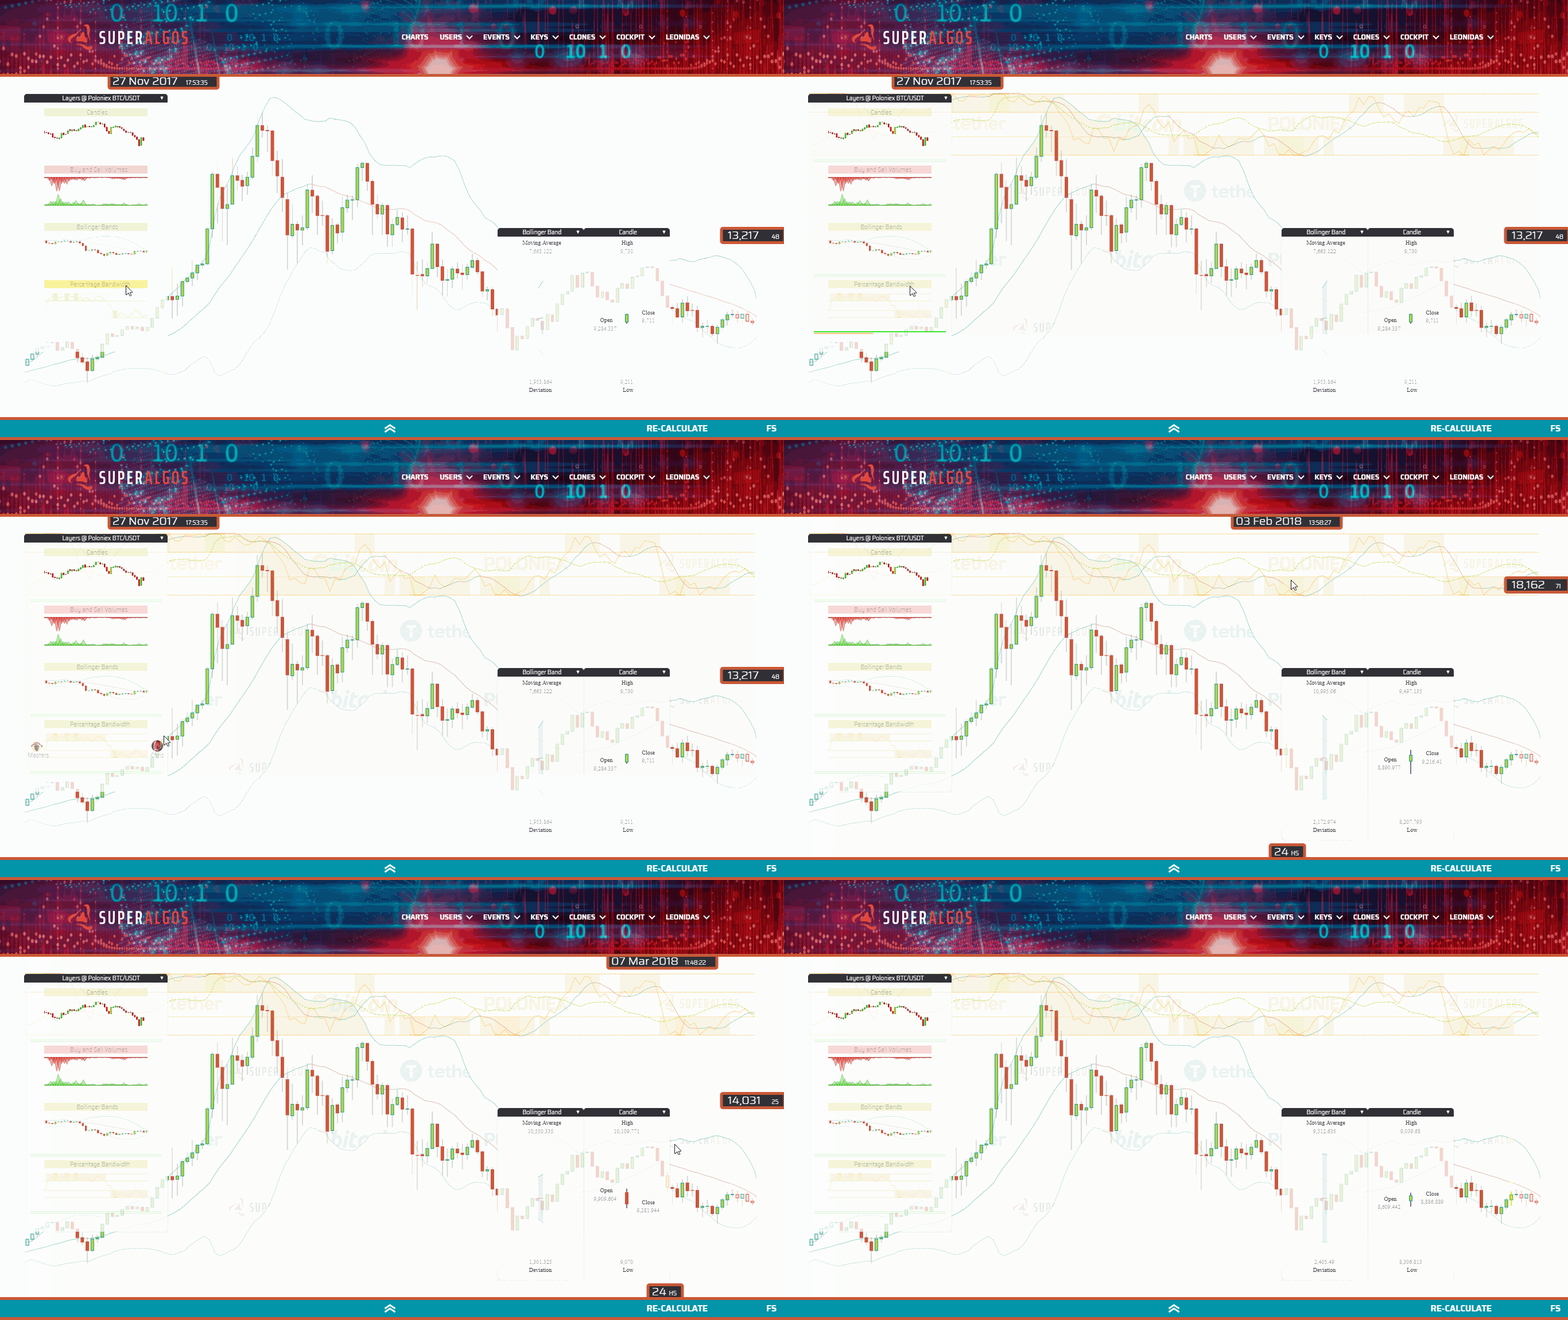
The chart features lines at %B value 30 and 70 since those are the most common values for traders to forecast when a reversal may happen. In our chart, %B is the one represented at #1. I've found useful to add a moving average in order to smooth volatility a bit, and to be able to ask—at any time—if it is going up or down. The moving average calculated with the last 5 %B values is plotted as line #2. Finally I also added a property called Bandwidth, which represents the separation of the upper band from the lower band. It is a measure of the volatility and is plotted at #3.

7. Bollinger Channels: This is a non-standard indicator derived from the Bollinger Bands. These types of channels are calculated using the Bollinger Bands moving average. Essentially an upward channel begins when the moving average turns from going down to going up, and the channel finishes when it turns from going up to down. A downward channel starts when the Bollinger Band moving average turns from going up to down, and it finishes when it starts going up again. Upward channels are plotted in green, while downward channels in red. Additional information can be found at the indicator's panel, like the number of periods contained at the channel.

8. Bollinger Sub-Channels: If we consider that one Bollinger Channel can have sub-channels with the same direction (up or down) but different slopes, then we get to the concept of Bollinger Sub-Channels. The most important property of a sub-channel is its slope. The possible values are: side, gentle, medium, high and extreme. With this information, a trading bot could easily ask if it is in a sub-channel with a certain slope and for how many periods.
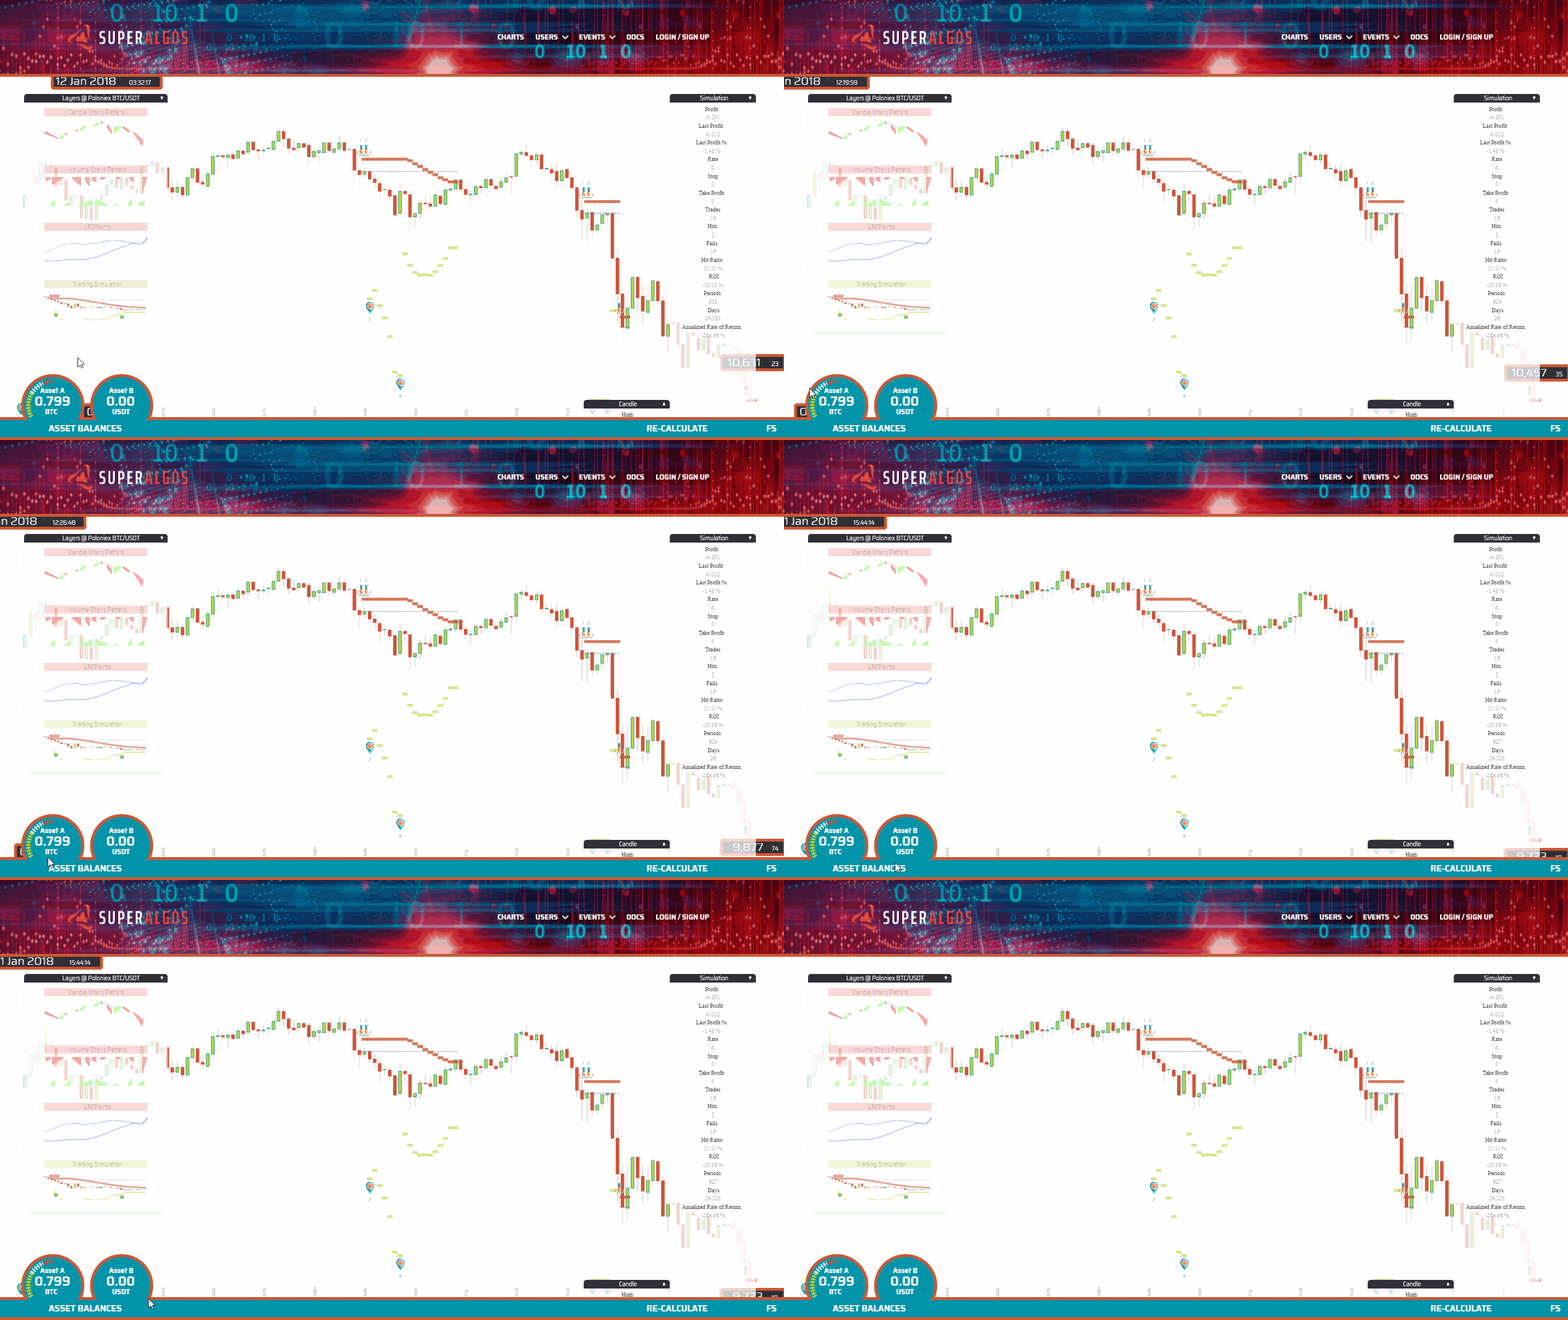
- Trading Simulation: The Trading Simulation layer displays a backtest + fordwardtest (paper trading) of whatever strategies you have created in the system. At sign up, you are provided with an initial set of strategies so that you can be up and running as quickly as possible. By activating the Trading Simulation layer you should be able to see something like this:

Notice Asset Balances in the bottom left corner of the screen. Asset A is your base asset.
The dashed line represents the duration of the trade at the price of the take position event. Notice how the base asset is exchanged for Asset B and back to the base asset as the trade closes.

Notice the green horizontal bars indicating the take profit value for each period (candle). Take profit is managed in phases, marked with the corresponding icons.

Notice the red horizontal bars indicating the stop value for each period (candle). Stop is managed in phases, marked with the corresponding icons.

2. Trading Conditions: The Trading Conditions layer helps identify which conditions are met at each candle. Notice how conditions are highlighted as the cursor moves through different candles.

3. Simulation Strategies: The Simulation Strategies layer identifies trigger on and trigger off events, signaling the activation and deactivation of strategies.
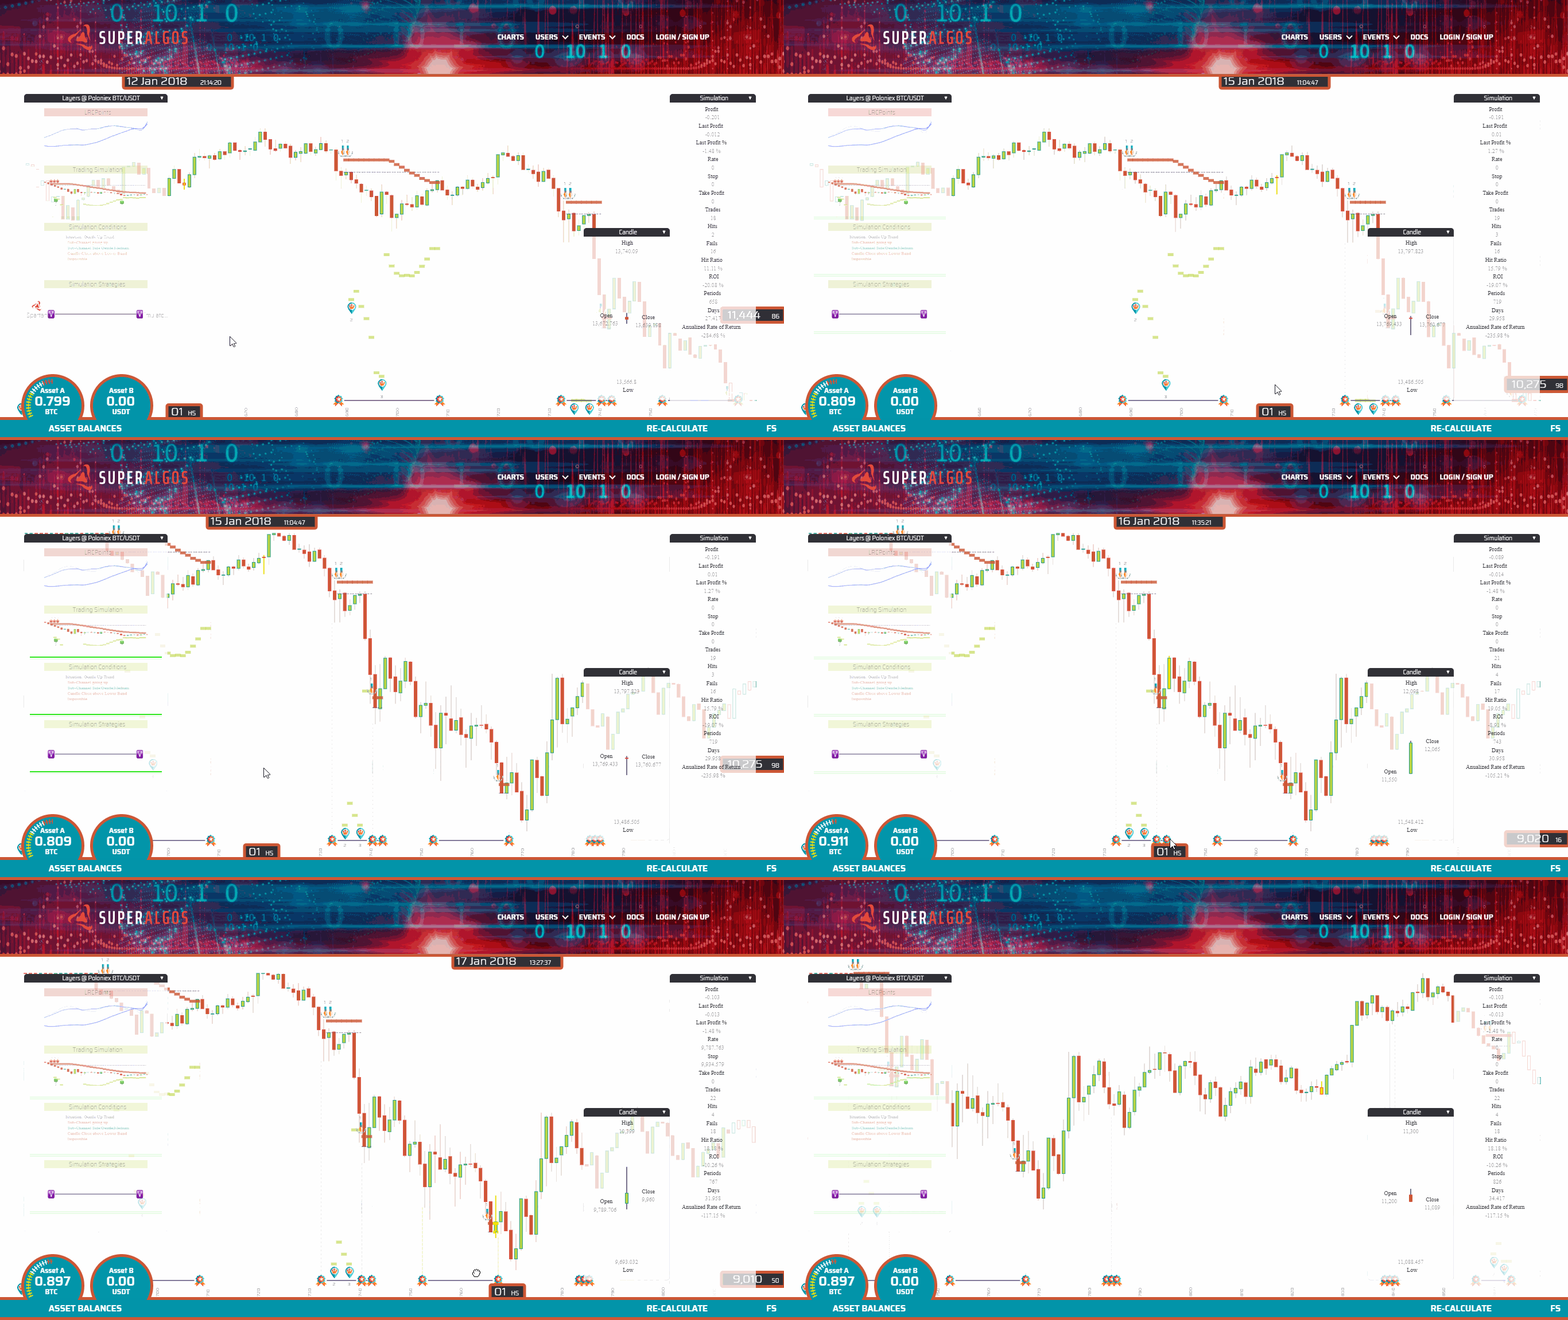
4. Simulation Trades: The Simulation Trades layer marks trades with a triangle whose hypotenuse connects the price at the take position event with the exit price. When the trade is profitable, the triangle is green; when the exit happens at a loss, the triangle is red.
The Strategy Designer organizes strategies following the framework established by the Superalgos Protocol. If you are not familiar with the protocol, please read either of the following articles:
-
Superalgos Protocol V0.1 - the Short Version, for Experienced Traders (link pending).
-
Superalgos Protocol V0.1 - the Long Version, for Beginner Traders (link pending).
The Strategy Designer provides a Graphic User Interface for traders to input the rules and formulas that determine the behaviour of the strategy. Traders need to define the rules to trigger on and trigger off the strategy, to take a position, to manage take profit targets and stop loss.
The protocol calls these sets of rules situations, in the sense that you are trying to determine what is going on with the market and, if the 'situation' is right, certain actions or events should be triggered.
In other words, you define situations in which you wish a certain event to happen (i.e.: trigger on the strategy, take a position, etc.) and each situation is described as a set of conditions that need to be met in order for the event to be triggered.
When all conditions within a situation evaluate true, then the situation evaluates true.
Events may be triggered in different situations, meaning that you are free to define different situations upon which the event would be triggered. In such case, when any of the situations evaluate true, then the event shall be triggered.
In order to define conditions you will use statements using any of the available variables that describe what is happening with the market. Remember, conditions need to evaluate either true or false.
For example:
Situation 1
- Condition A: candle.close > bollingerBand.MovingAverage
- Condition B: candle.previous.max > bollingerBand.MovingAverage
In the example above, conditions A and B are mathematical comparison statements that may evaluate either true or false. In the case both would evaluate true then Situation 1 would be true.
candle.min: The minimum price of the current candle.
candle.max: The maximum price of the current candle.
candle.open: The price at which the current candle opened.
candle.close: The latest price of the current candle.
candle.direction:
- Down: candle.close > candle.open
- Up: candle.close < candle.open
- Side: candle.close = candle.open
candle.previous: Refers to the previous candle. You may use candle.previous to fetch any of the variables of the previous candle (i.e.: candle.previous.close). You may also use as many .previous as required to fetch values of more than one period behind the current one (i.e.: candle.previous.previous.max returns the maximum value of two candles before the current one).
bollingerBand.movingAverage: The value of the current moving average (20 periods).
bollingerBand.standardDeviation: The value of current the standard deviation.
bollingerBand.deviation: bollingerBand.standardDeviation * 2
bollingerBand.direction:
- Down: bollingerBand.previous.movingAverage > bollingerBand.movingAverage
- Up: bollingerBand.previous.movingAverage < bollingerBand.movingAverage
- Side: bollingerBand.previous.movingAverage = bollingerBand.movingAverage)
bollingerBand.previous: Use .previous like with candles (see candle.previous above).
percentageBandwidth.value: The current value of the percentage bandwidth.
percentageBandwidth.movingAverage: The current value of the percentage bandwidth moving average.
percentageBandwidth.bandwith: The current bandwith.
percentageBandwidth.direction:
- Down: percentageBandwidth.previous.movingAverage > percentageBandwidth.movingAverage
- Up: percentageBandwidth.previous.movingAverage < percentageBandwidth.movingAverage
- Side: percentageBandwidth.previous.movingAverage = percentageBandwidth.movingAverage)
percentageBandwidth.previous: Use .previous like with candles (see candle.previous above).
bollingerChannel.direction (Down | Up | Side):
bollingerChannel.period: The number of periods the channel spans at the moment the variable is being read. For instance, if a channel spans 10 candles and the variable is checked on the fourth candle, then bollingerChannel.period = 4. Put in other words, it is the current span of the channel.
bollingerSubChannel.direction (Down | Up | Side):
bollingerSubChannel.period: The number of periods the subchannel spans at the moment the variable is being read. For instance, if a subchannel spans 10 candles and the variable is checked on the fourth candle, then bollingerChannel.period = 4. Put in other words, it is the current span of the subchannel.
strategyStage (No Stage | Trigger Stage | Open Stage | Manage Stage | Close Stage):
stopLoss: The value of your Stop in the active phase.
stopLossPhase (0 | 1 | ...): The number of the active Stop phase.
takeProfit: The value of the Take Profit in the active phase.
takeProfitPhase: The number of the active Stop phase.
positionRate: The price at which the position was taken.
positionSize: The size of the position.
positionInstant: The datetime in which the position was taken.
balanceAssetA: The balance of your base asset.
balanceAssetB: The balance of the second asset.
lastTradeProfitLoss: The P&L value for the latest completed trade (roundtrip).
lastTradeROI: The ROI of your latest trade.
profit: The total P&L during the current execution period.
roundtrips: The total number of trades in the current execution.
fails: The number of trades resulting in losses in the current execution.
hits: The number of trades resulting in profits in the current execution.
periods: The number of candles evaluated in the current execution.
| Luis-Fernando-Molina |


