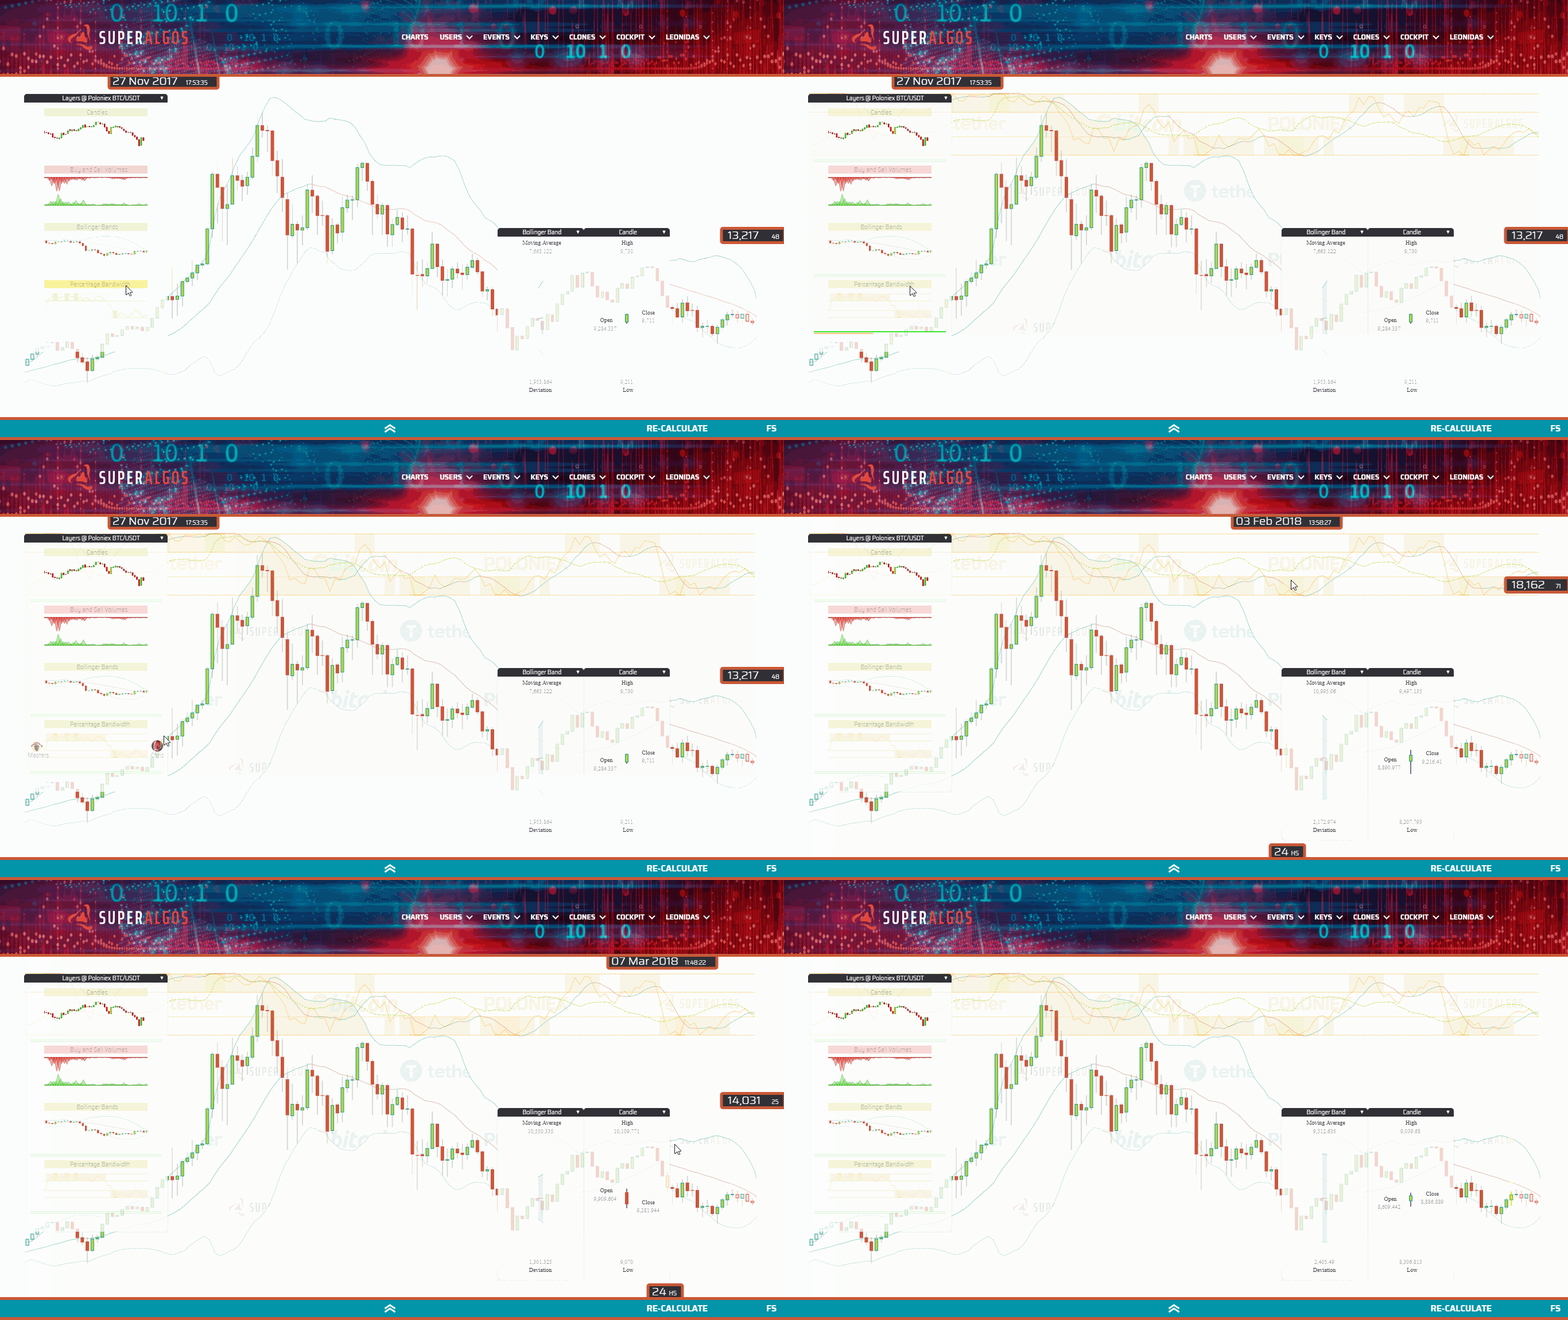
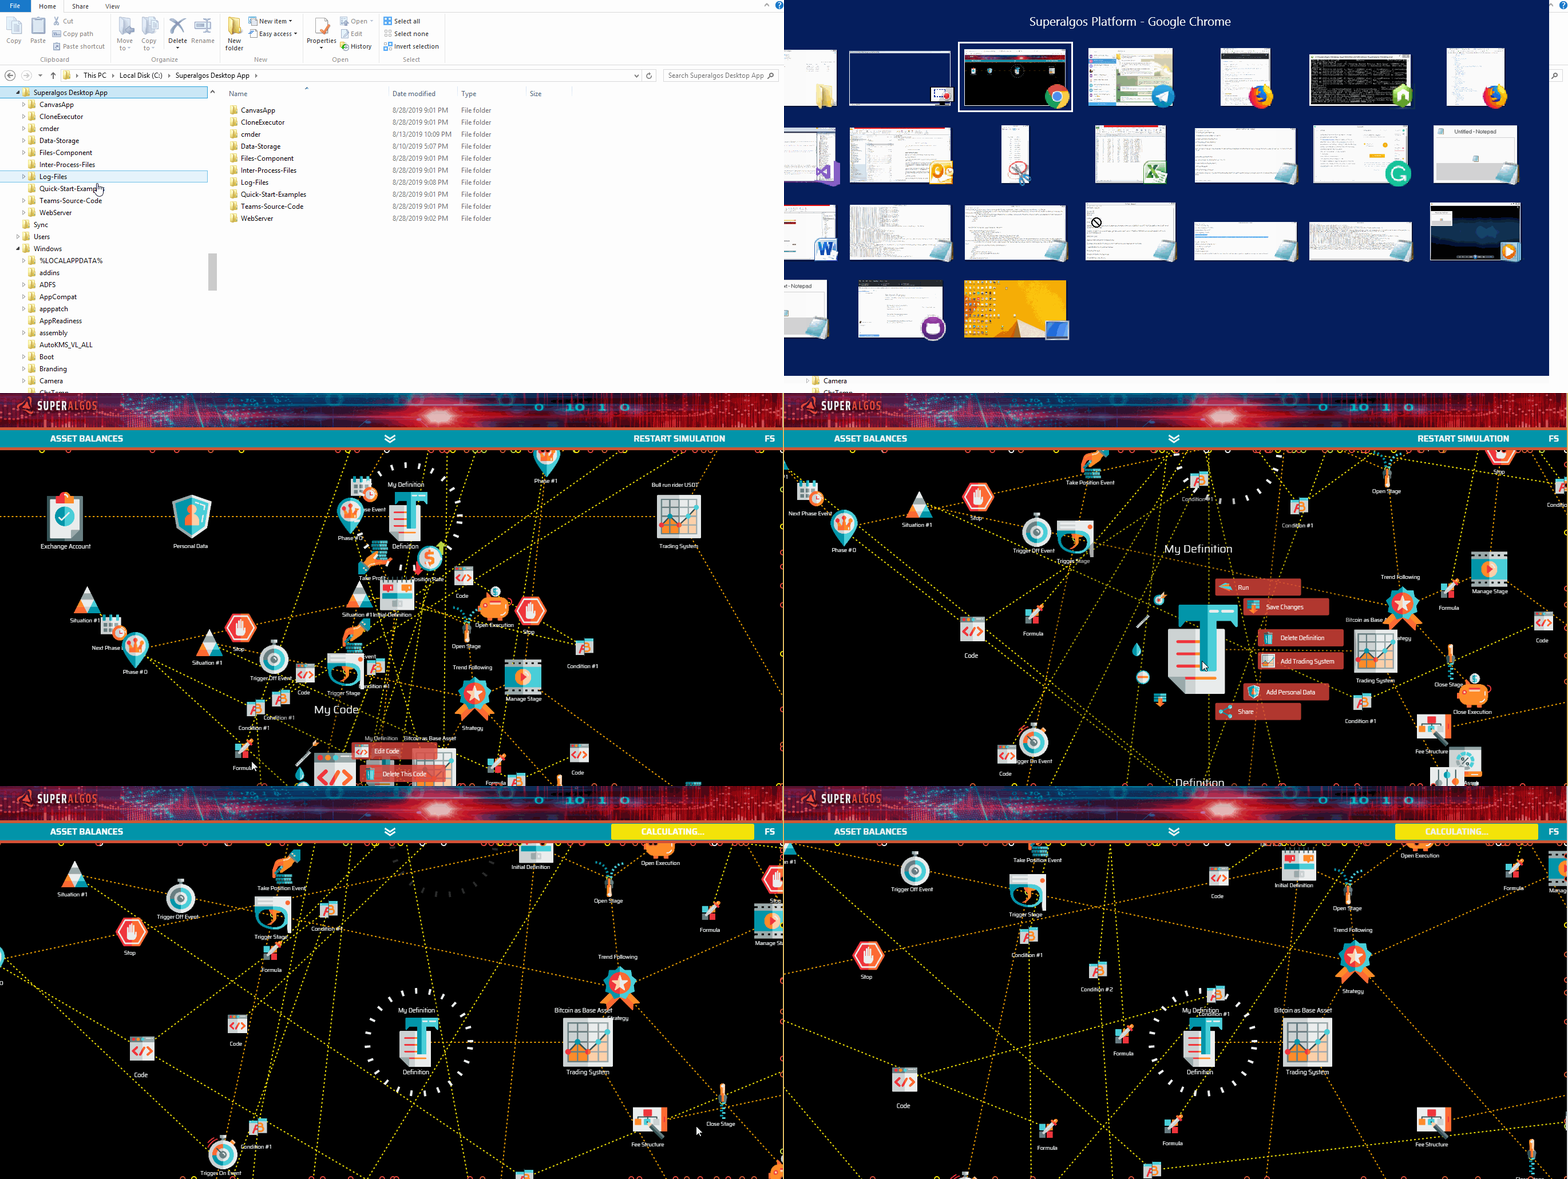
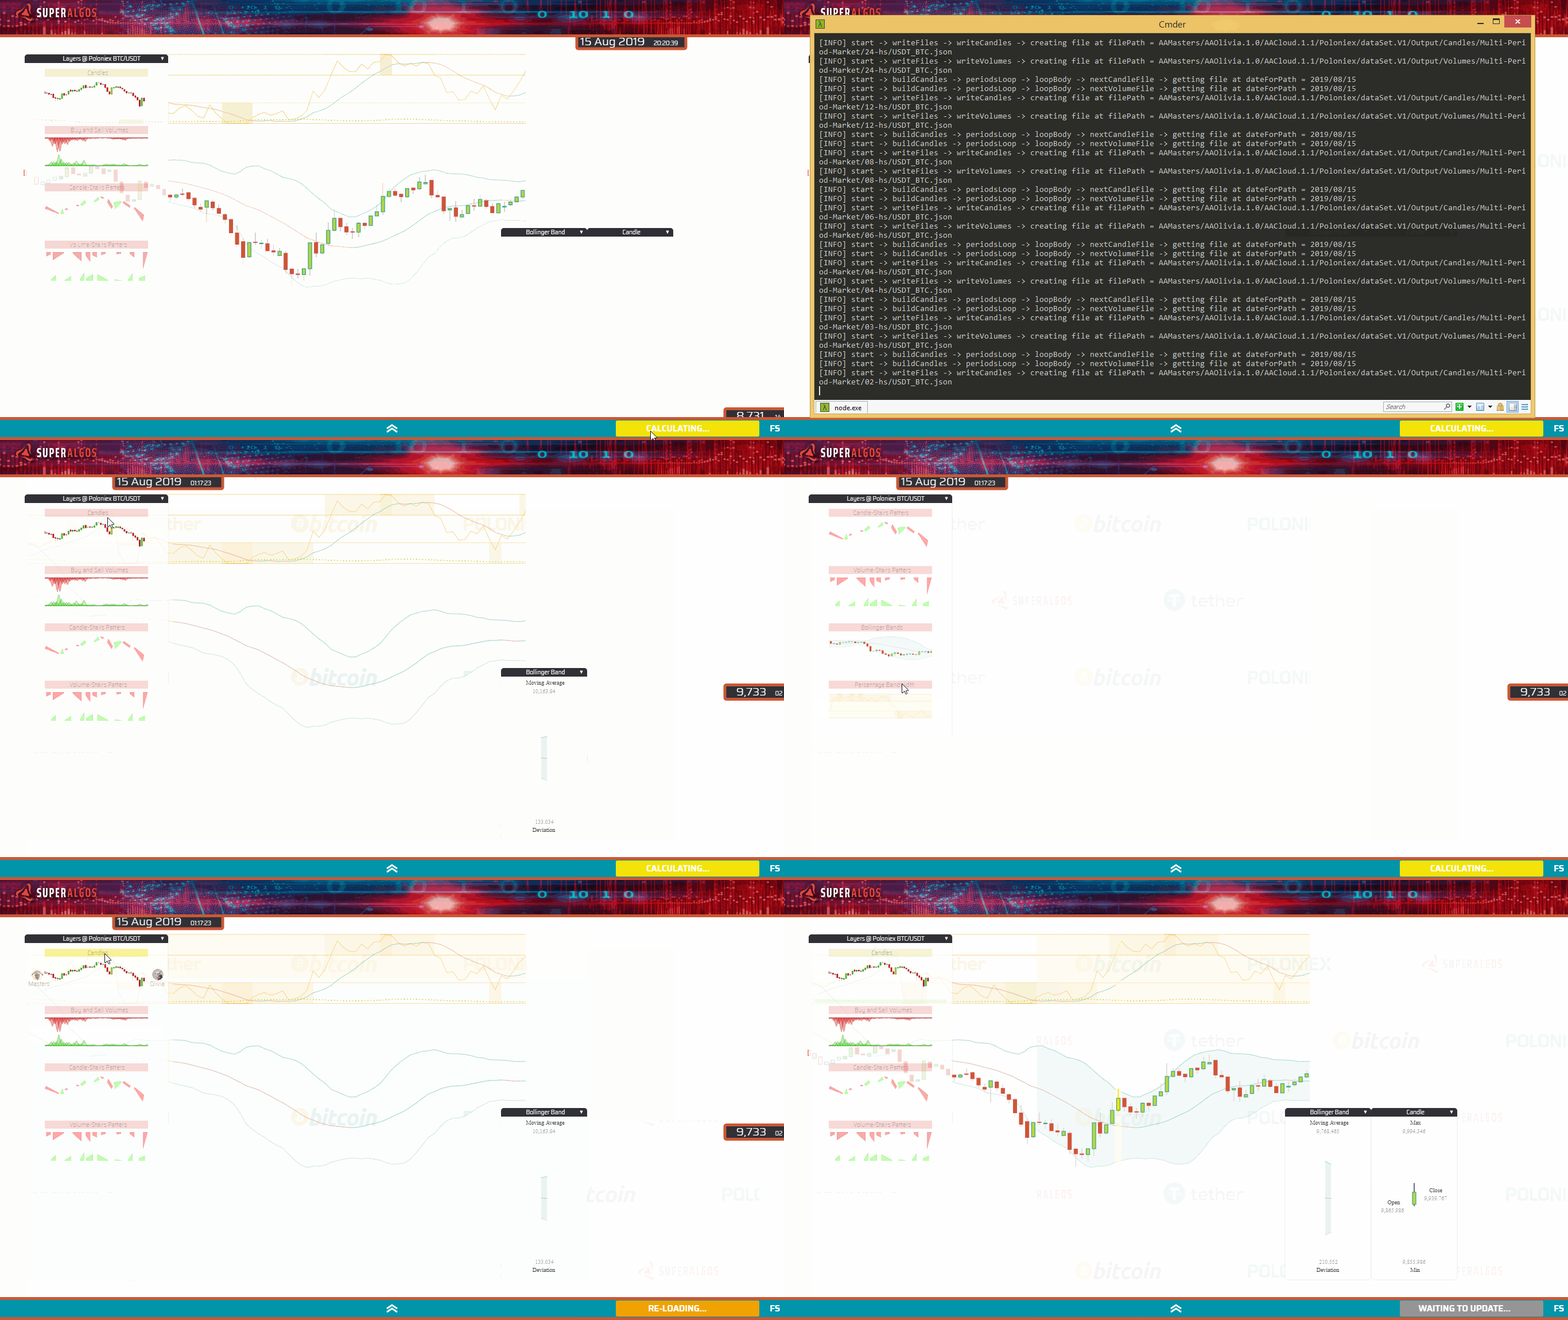
The Superalgos Desktop App is the client application of the Superalgos Platform suite, and provides a visual environment for developing and automating crypto-trading strategies.
This is a pre-release in alpha stage. The app is still under heavy development. We appreciate your help testing the app and reporting any errors you may experience.
Please refer to the Superalgos Desktop App page to understand who this app is directed at, as well as what you can expect from the app in terms of user experience, current features and limitations.
- Getting Started
- Upgrading Your Existing Installation
- Overview
- Charts Interface
- Designer
- Simulation
- Live Trading
- Advanced Use
- Troubleshooting
- Reporting Bugs
- Technical Overview
The following recommendations may make your life easier using this pre-release in alpha stage:
-
We highly recommend you use Chrome to run the app, so that you have a similar environment as developers in case you need help.
-
You will benefit from having a decent Console / Command Line application for similar reasons: we hope you won't need it, but in case you do, it may save you lots of hassle and make a difference troubleshooting and getting help from the community. We recommend Console Emulator Cmder.
Bear in mind that the app evolves fast. We do our best to keep this README up to date, however, some of the images illustrating these explanations may defer from what you will find in the app.
WARNING: The Superalgos Desktop App is at a very early stage of development. As such, errors may occur at any point, including errors that can cause you to lose money. You are responsible for taking all precautions before starting trading live. Make sure you test with small amounts of money, the kind you can afford losing. Trade live at your own risk.
1. Downloads:
Download the software package from the latest software release (Superalgos-Desktop-App.zip) and extract the file in an accessible route (you will launch the app from these folders).
Download historic market data from the latest data release (Poloniex.BTC.USDT.Historic.Data.zip) and extract the file inside the Superalgos Desktop App folder generated by the software ZIP package.
You should end up with the following folder structure:
Make sure the data ended up as the
Data-Storagefolder, right inside theSuperalgos Desktop Approot folder.
2. Continue with Running the App
NOTE FOR DEVELOPERS: Instead of using the executable file to run the app, you may want to use
node runfrom within the rootSuperalgos Desktop Appfolder, to run on your full Node Js installation.
1. Download the Software Package:
Go to the latest Superalgos Desktop App release and download Superalgos-Desktop-App.zip.
2. Extract the ZIP file:
How you extract/unpack the files depends on the software you use to handle ZIP files. Double-clicking the ZIP file should work in most scenarios, however, some systems may "open" the file instead of "extracting" or "unpacking" it. Make sure you are "extracting" and not just "opening" the file. You may also right-click the file and check the options available on the pop-up menu.
When you extract the ZIP file, a folder structure will be created with the root folder being Superalgos Desktop App.
You may extract/unpack the files in any location of your drive, however, we recommend unpacking in an accessible route (i.e.: C:\), as you will later need to fit an additional folder inside the Superalgos Desktop App folder, and you will also need to access these folders every time you launch the app.
3. Download the Data Package:
For your convenience and the reasons explained in the Superalgos Desktop App page on the website, we maintain a downloadable market-data file that you can download, so that you may be up and running as quickly as possible.
Go to the latest Data release and download Poloniex.BTC.USDT.Historic.Data.zip.
The ZIP file includes highly-compressed complete historic BTC/USDT Ploniex market data. Expect decompression to take from 30 to 60 minutes, depending on your system. Once you have the historic data, the app will make sure the data stays up to date.
4. Extract the ZIP file:
You need to extract the file inside the Superalgos Desktop App folder generated by the first ZIP file. You can achieve this in two ways:
A. Move Poloniex.BTC.USDT.Historic.Data.zip inside the Superalgos Desktop App folder, right-click the ZIP file and select Extract here in the pop-up menu. This is the quickest method.
B. Extract the ZIP file anywhere else and then move the resulting Data-Storage folder inside the Superalgos Desktop App folder. This will take almost double the time.
You should end up with the following folder structure:
Make sure the data ended up as the
Data-Storagefolder, right inside theSuperalgos Desktop Approot folder.
1-A. In Windows systems, use the executable file to run the app:
Go to the Superalgos Desktop App folder and double click on Superalgos.exe. Now, skip the Mac instructions and go directly to point 2 below.
1-B. In Mac systems, download and install Node JS:
Node.js is an open source server environment required for the app to run. Go to the Node Js downloads page and download the Mac installer. Run the installer and go through the process until Node Js is installed.
Now, use the Finder app to go to the Superalgos Desktop App folder and do a secondary click (tap the touchpad with two fingers) to open up the menu. Select New Terminal Tab at Folder. Once in the Terminal, type node run and hit Enter.
2. Drag and drop an example workspace:
The app will load on your default browser. You should either set Chrome as your default browser before executing the file or simply close the non-Chrome browser, open Chrome and go to http://localhost:1337/.
Also, a Console/Command Line/Terminal window will open. The Console must be open for as long as the app is running. Do not close the window or stop the processes running on it. You may minimize the Console if your Operating System allows you to do so.
Closing the Console/Command Line may cause your market data to become corrupt. The proper way of closing the application is closing your browser first, and allow a minute for processes to stop before closing the Console.
Go to the Superalgos Desktop App/Quick-Start-Examples folder, drag your preferred example file and drop it on the Designer (the area with a black background in the bottom half of the screen) to start with a working template.
Available Quick Start Examples:
Share - Workspace - Bull run rider - USDT- 1hr.json: A functional USDT-based strategy designed for bull markets. You will be able to run a backtest and see the strategy in action if you use this template. All details about the strategy may be found in the Superalgos/Strategy-USDT-BullRunRider repository.
Share - Workspace - Weak-hands buster - BTC - 1hr.json: A functional BTC-based strategy designed for accumulating bitcoin during bear markets or market consolidation situations. You will be able to run a backtest and see the strategy in action if you use this template. All details about the strategy may be found in the Superalgos/Strategy-BTC-WeakHandsBuster repository.
Share - Workspace - Empty Strategy Structure Template.json: A template containing the minimum set of elements required to build your own strategy. Elements are empty (undefined); this is just the structure that will guide you through the process of building your strategy. You will not be able to run a backtest or trade live with this template until you set up your strategy.
That's it! You are up and running!
Now you are ready to learn the basic operation of the app so that you may run your first backtests or trade live with existing strategies.
To run your first backtest you will need a functional strategy.
1. Import the right template:
If you haven't yet, start by importing either Share - Workspace - Bull run rider - USDT- 1hr.json or Share - Workspace - Weak-hands buster - BTC - 1hr.json. To do that, follow the instructions above to drag one of the files from the Superalgos Desktop App/Quick-Start-Examples folder and drop it in the Designer section of the app.
2. Start processes:
| Task Manager | Definition |
|---|---|
 |
 |
Open up the Designer section of the app by dragging the horizontal bar upwards and locate the two Task Manager elements connected to the Definition element on the left-hand side of the screen.
To move around the Designer, click on the black background and drag to pan in the desired direction.
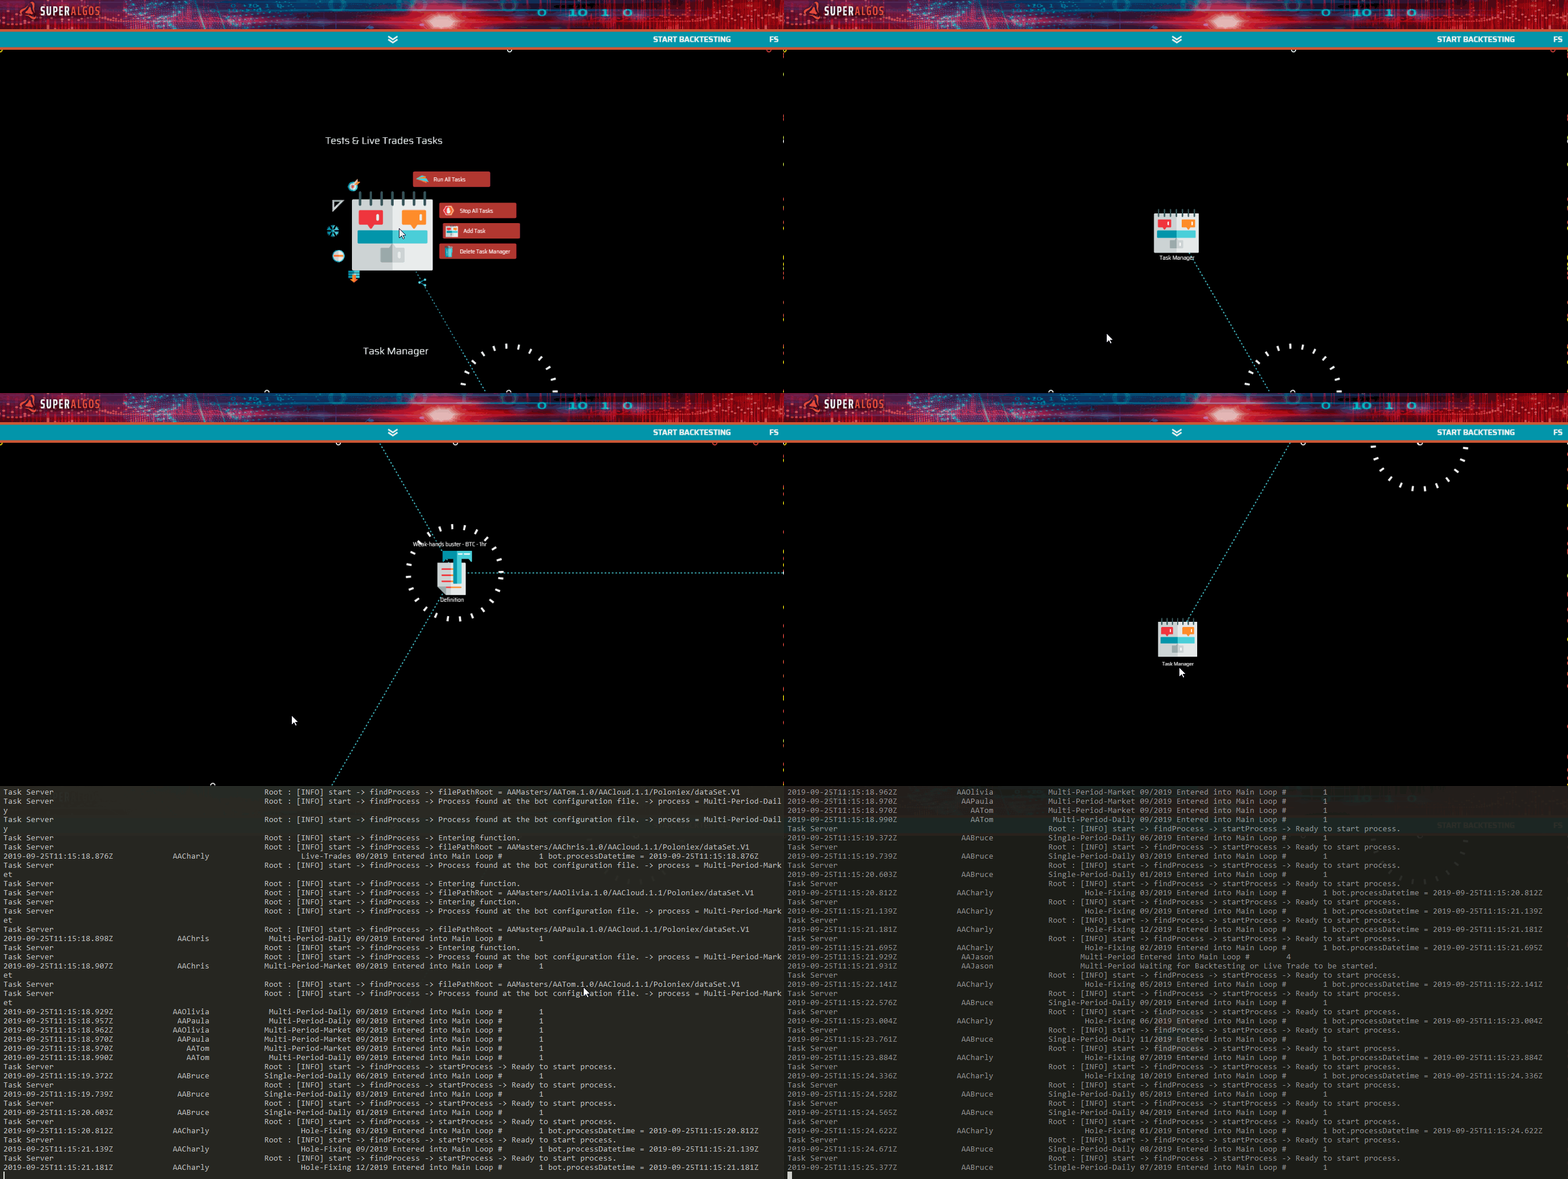
Then, hover your mouse pointer over either of the Task Manager elements and click Run All Tasks in the menu. You will not see any immediate effect in your browser, but if you take a look at the Console, you will notice activity indicating that several processes are running.
Do the same with the second Task Manager element.
NOTES ON MARKET DATA: You just started the Trading Engine along with the sensors that extract live data from the exchange and the indicators that process raw trades data. These processes will remain running for as long as you keep the browser open running the app. The bots processing exchange data and building indicators datasets will work to bring your data up to date. In our experience, it may take between 10 to 20 minutes per day worth of Poloniex data to be processed. The time it will take for these processes to complete the job depends on several things:
- The date of the release tells you how many days you are behind with the data set you just downloaded.
- The speed and processing power of your machine will make a difference too.
- The average number of trades per day at the exchange determines the volume of data the app needs to retrieve and process.
- The number of trades the exchange returns per each request determines the size of the pipeline the exchanges allow API users to use.
3. Run your first backtest:
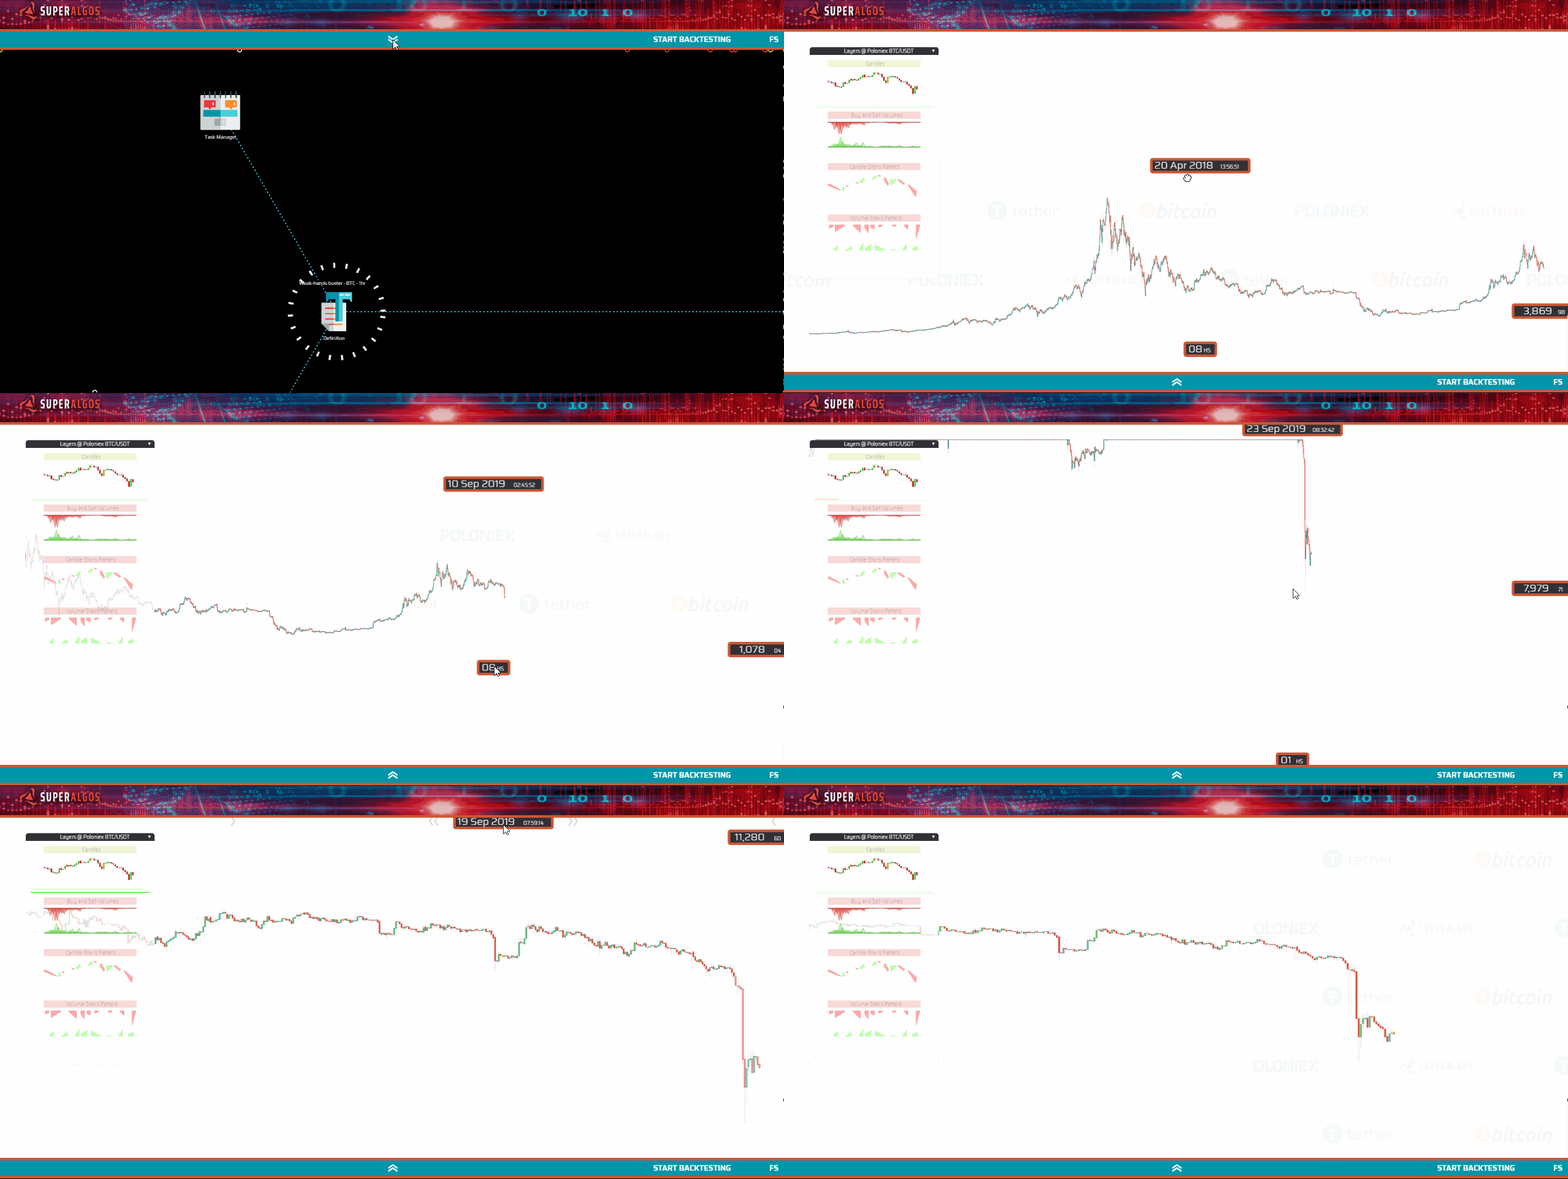
Pull down the horizontal bar to go to the charts and make sure you are standing in the 1 hr (one hour) time period. Notice the time box at the bottom of the charts:
If you are not, use the wheel of your mouse while pointing at the charts to scroll into the 1 hr time period. You do this so that the backtest runs in the time period for which the strategy was designed.
You are now ready to click the START BACKTESTING button on the right-hand side of the horizontal bar.
Once you click the button, it will turn yellow. It may take several minutes for the Trading Engine to do the calculations and get ready to present the simulation over the charts. Once the Trading Engine finishes, the button will turn back to its normal state. That means that you may now turn on the simulation layers in the Layers Panel.
You may now navigate the charts by clicking and dragging, or by zooming in and out with the wheel of your mouse. If you change the time period, you will not see the simulated data, as each time period may hold its own simulation.
Congratulations! You've run your first simulation!
The rest of this README file contains all the information you need to build your own strategies, modify, test and use existing ones, and eventually start trading live.
You should expect patches and even new releases to become available regularly. Appropriate notices will be placed on the Official Superalgos Telegram Announcements Channel, which will be forwarded to the several Community groups when this happens.
If you have a version of the Superalgos Desktop App and wish to upgrade to a new version you should do the following:
1. Stop the app by closing your browser. Allow a minute or two until no activity stops before closing the Console/Command Line running the programs.
2. Make sure you are not storing any personal files, such as your Workspace backups and so on in your Superalgos Desktop App folders. Move them to a different location if you are.
3. You will keep the Data-Storage folder intact and delete all the remaining folders within the Superalgos Desktop App folder. You do not need to get rid of the historic market data every time you upgrade your app. Do not delete your Data-Storage folder.
4. Download the latest patch or latest release from the location advertised in the Official Announcement Channel.
WARNING: Always beware of what random people may post in open Telegram groups or forums. Patches and releases will always be made available at the Releases page of this repository only.
5. Extract/unpack the contents of the ZIP file directly into the Superalgos Desktop App folder. That's it. You are up and running with the new version. Simply start the app the same way you always do unless new instructions become available in this README file.
Watch the Superalgos Platform Quick Getting Started Guide video for a quick intro. The video is slightly outdated in that the Superalgos Desktop App (the client version of the Platform) does not require a login and does not feature a menu on top. Otherwise, the content is still valid.
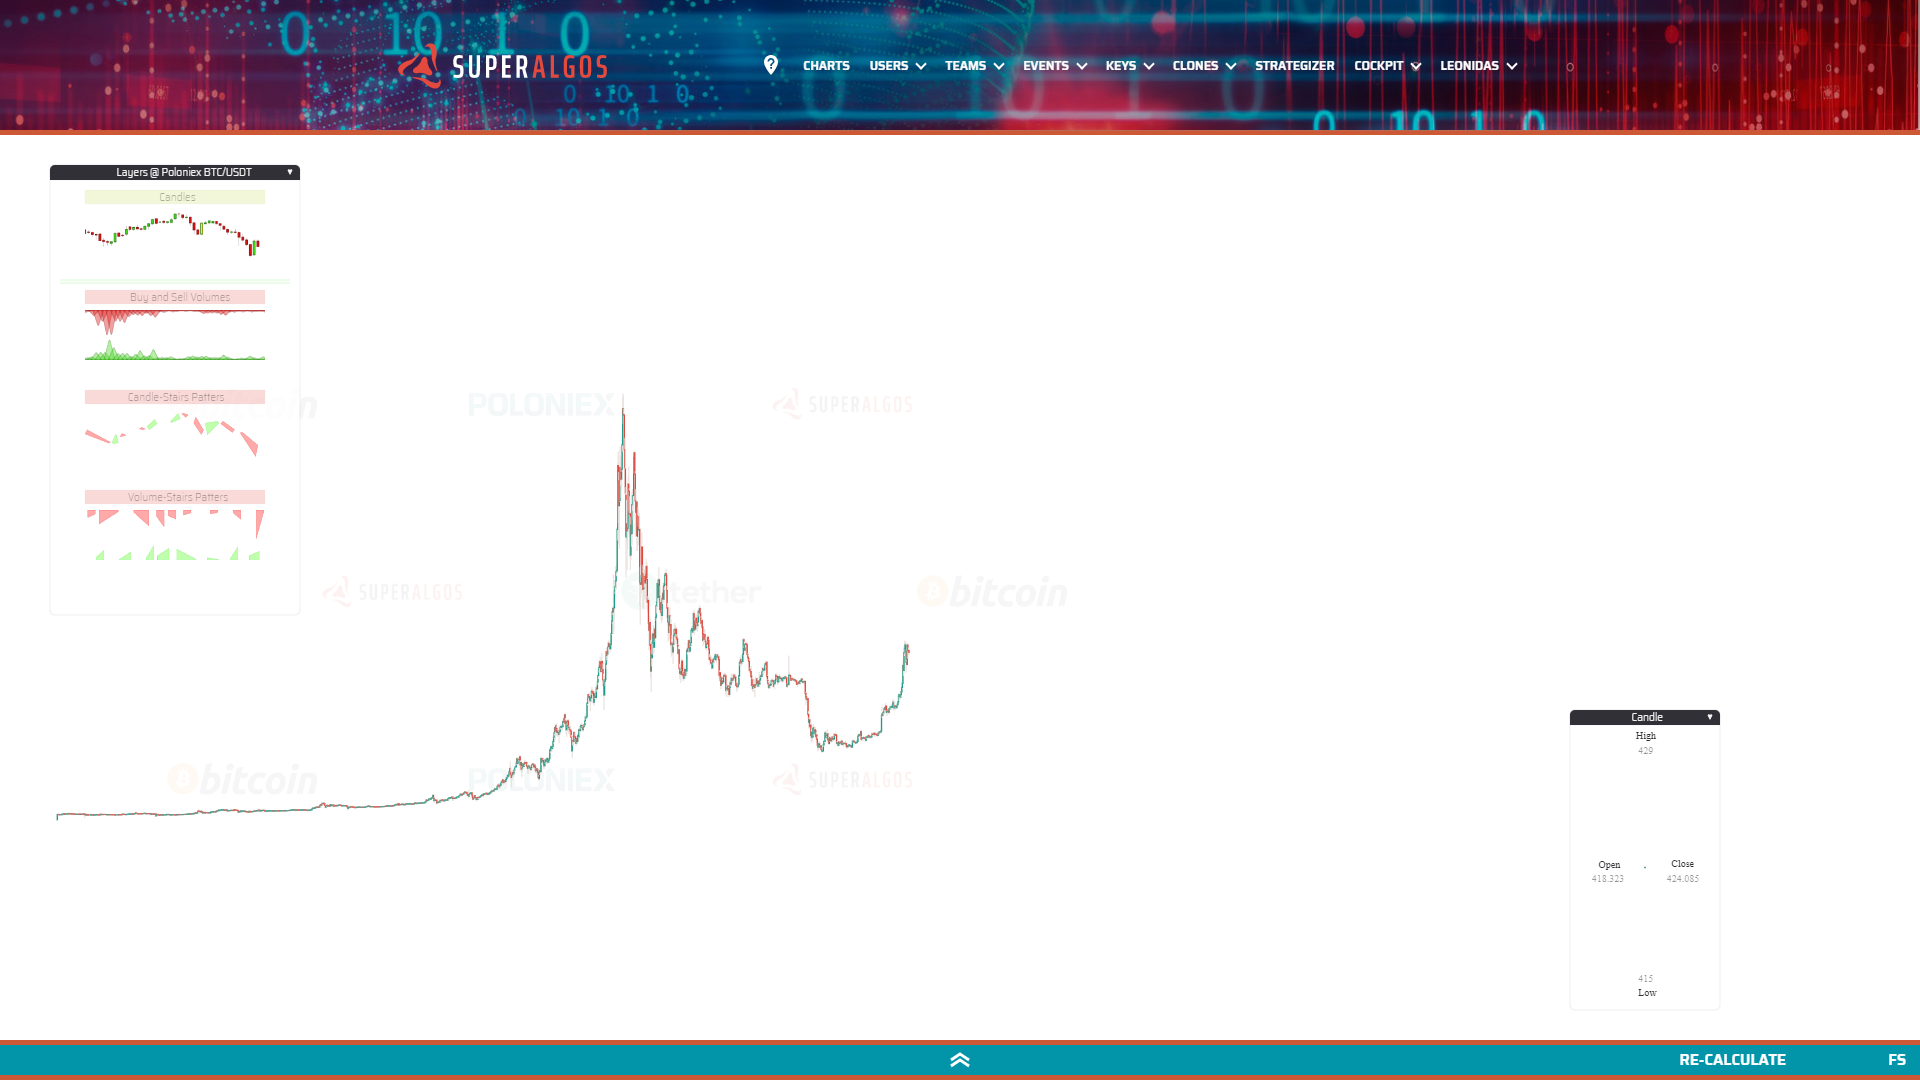
The first time you run the app, you will see the following screen, split in half. The top half features the space used by the Charting System and the bottom half features the Designer.
Use the control in the center of the turquoise bar to pull the bar up and down in order to make more room to either application.

Pulling the bar to the very top of the screen causes the Charting System to stop consuming resources in your local machine, and gives you an ample view of the Designer.
The Designer allows you to manage your Trading System. The structure represented by the various icons nested in a hierarchy of elements is the representation of the logic behind your Strategies.

Pulling the bar to the very bottom of the screen causes the Designer to stop consuming resources from your local machine, and offers a full-screen view of the Charting System.
The Charting System plots indicators data along with the actions taken by the Strategy Engine and the Executor, integrated with market data.
The Superalgos Protocol (also referred to as the protocol) determines the structure in which all the information regarding a trading system is stored and—at the same time—provides a clear guidance on how traders using the various tools developed and distributed by the Superalgos Project shall create and automate their strategies.
You don't really need to know this, but for the sake of context...
The Strategy Engine backtests and forward tests the instructions defined on its protocol file input. In coordination with the Strategy Executor, the engine can also live trade.
The Strategy Executor interprets the execution instructions embedded at a protocol file. The instructions determine the type of order to use, and what to do in every possible situation that could emerge during the placement and management of exchange orders.
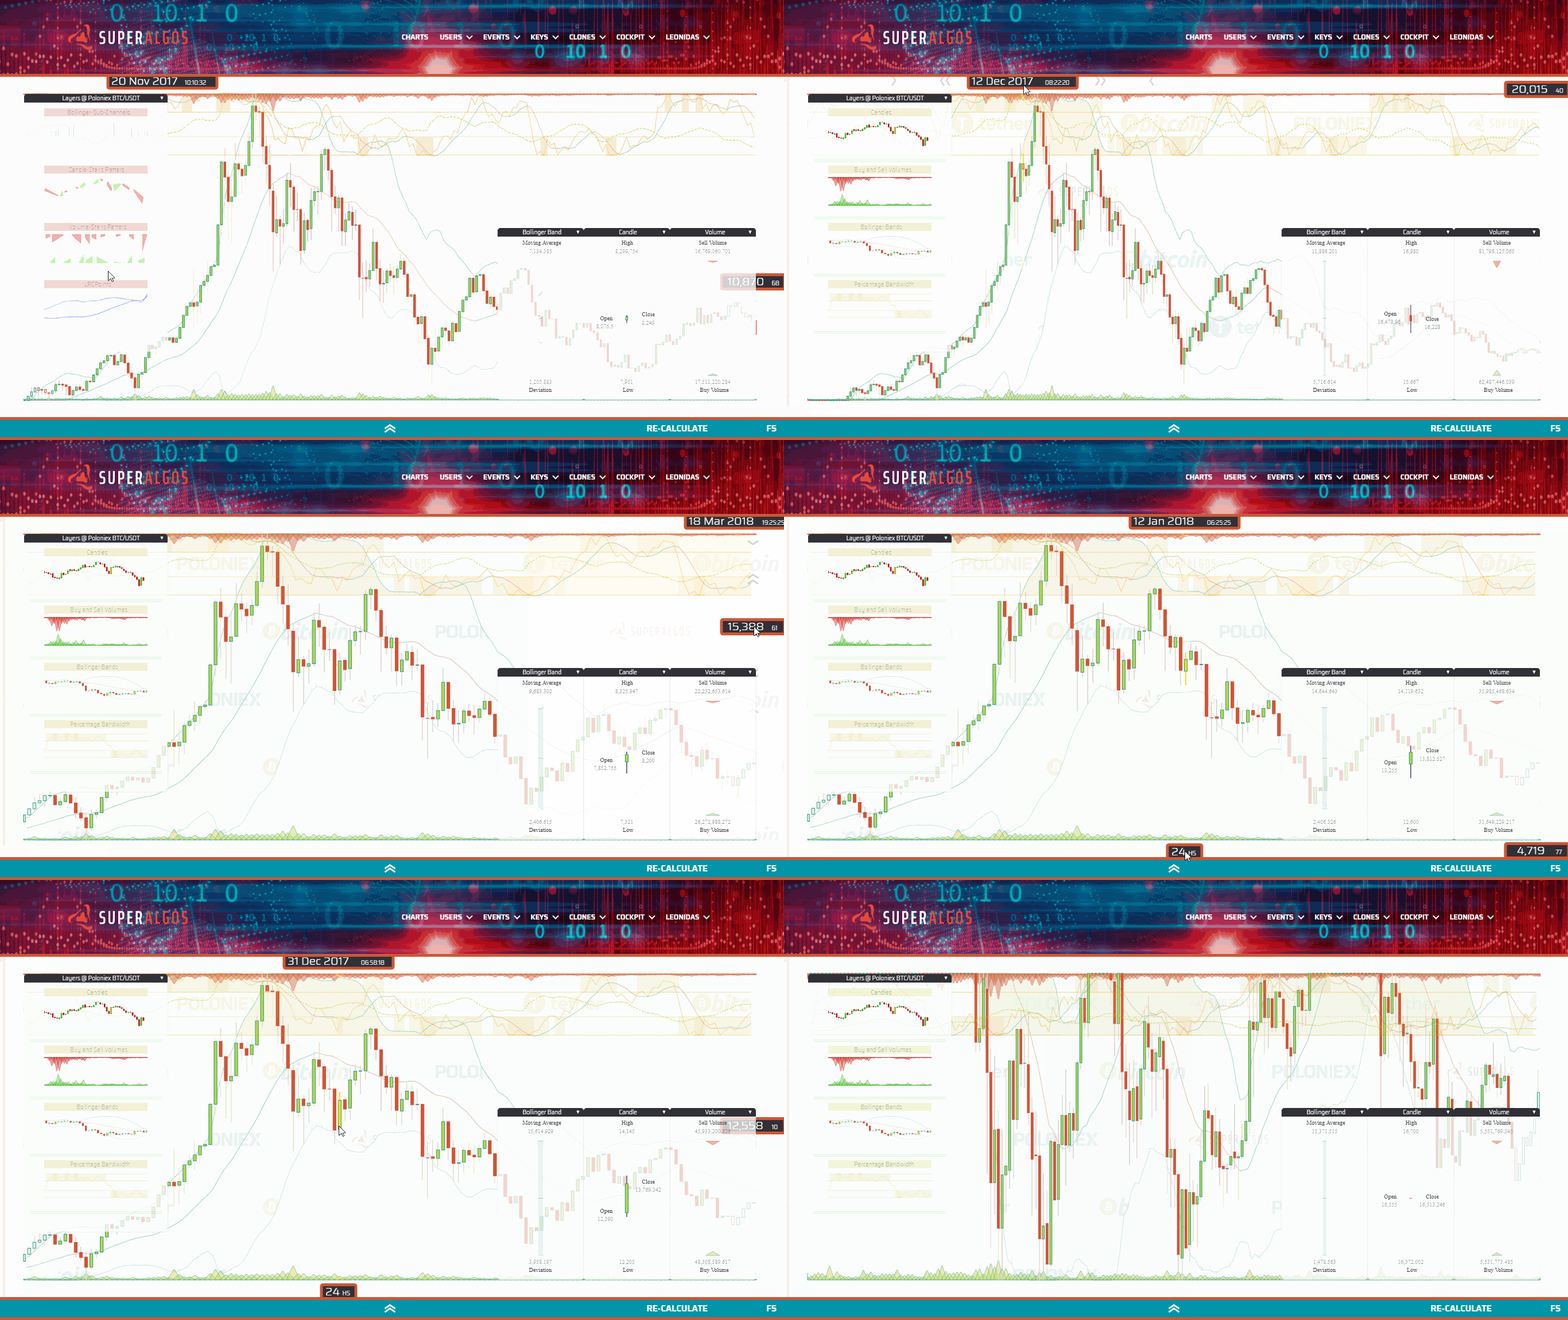
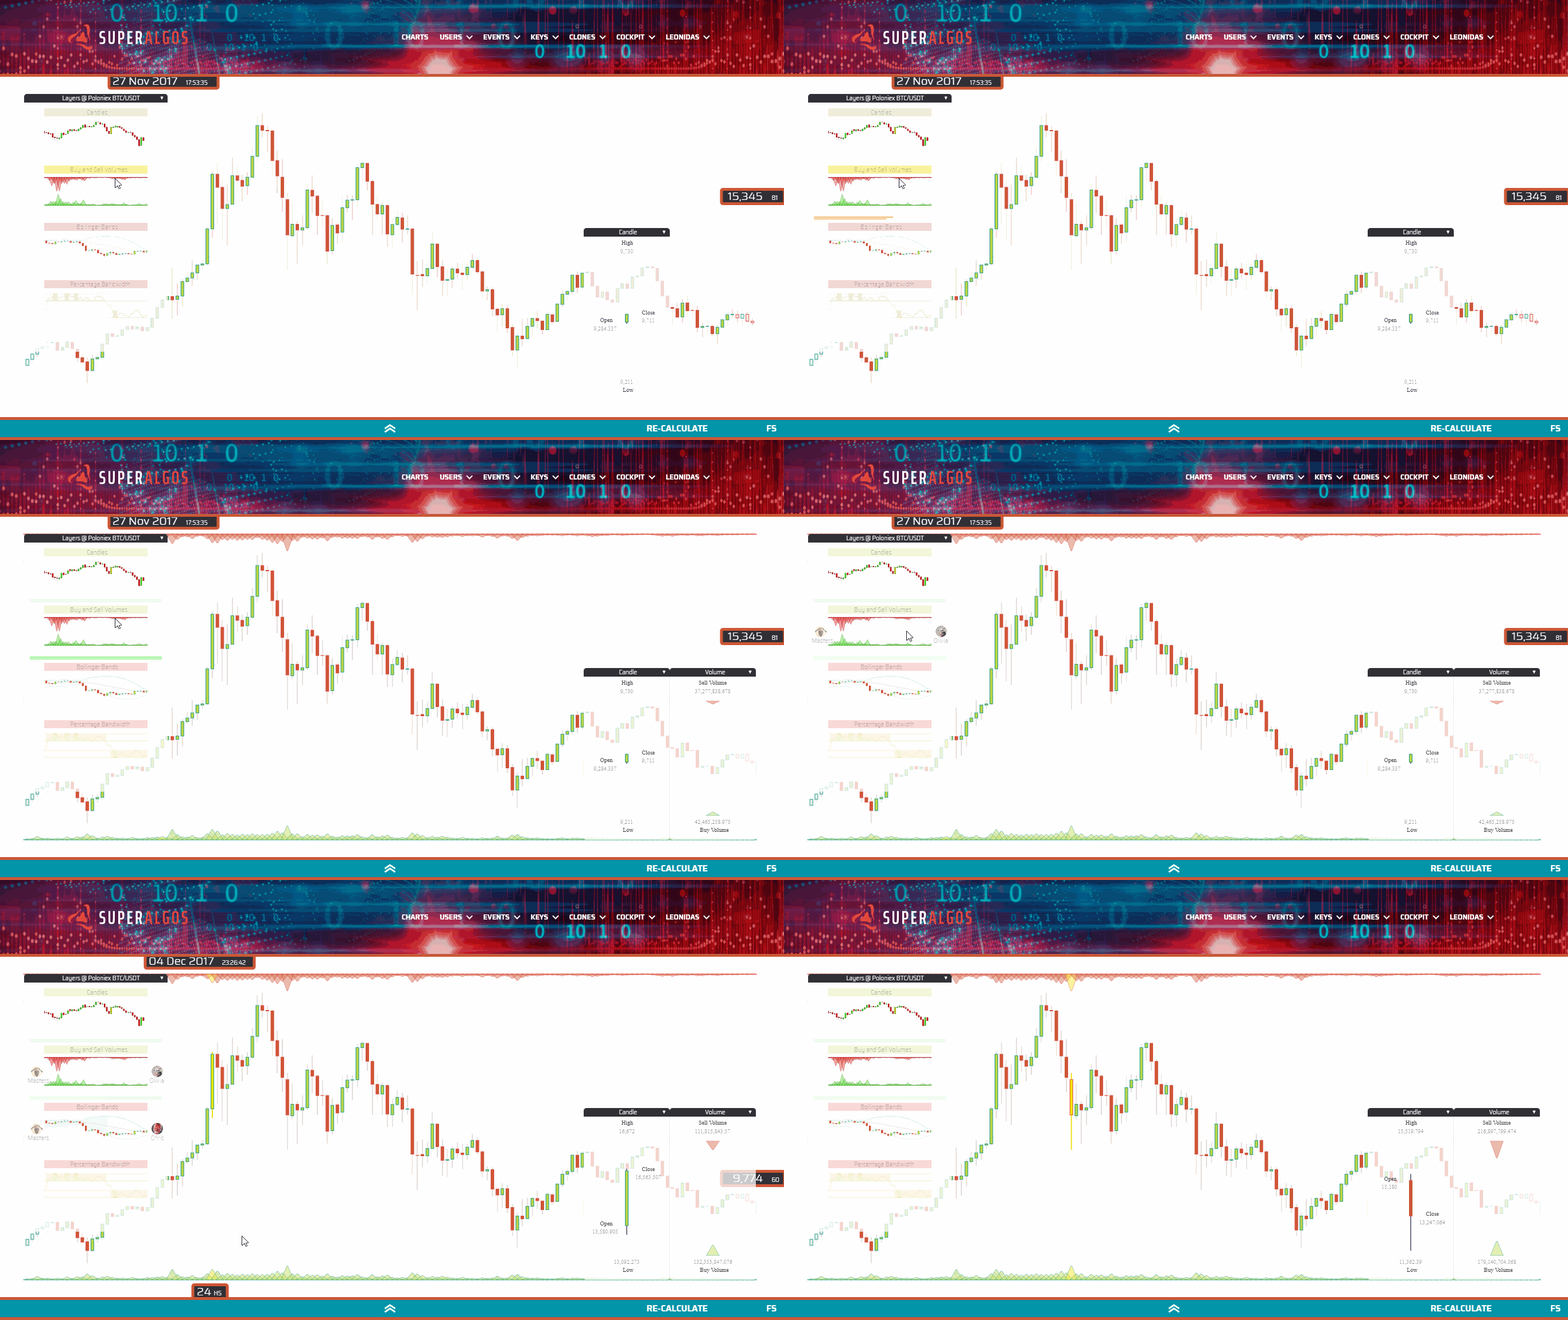
This panel includes different layers you may visualize by toggling them on and off with a single mouse clicks. The layer title bar can have 3 possible background colors:
- Red: layer is off.
- Green: layer is on.
- Yellow: layer is loading. If it stays yellow, it means it can't load fully.
Notice the following three elements relative to the position of the mouse pointer:
- Above, the current datetime. This is the date and time at the mouse pointer position.
- To the right, the current rate. This is the rate (in this case USDT per BTC) at the mouse pointer position.
- Below, the current time period (or candle size if you wish). This is the currently displayed time period—not only for candles, but for any other object plotted across available layers.
There are many things you can do with your mouse wheel.
- Scroll over the Layers Panel to access layers that may be out of reach downwards.
- Scroll on top of or next to the datetime to produce a horizontal scaling.
- Scroll on top of or next to the displayed rate to produce a vertical scaling.
- Scroll on top of or next to the time period to change the time period to available values.
- Scroll elsewhere over the chart to zoom in and out. The App will not only zoom in and out of the chart, but also automatically adjust the time period to the most convenient one (for the current zoom level).
To minimize a panel, click on the small triangle on the right of their title bar. This will automatically position the panel at the bottom of the screen. Clicking again restores the panel to its previous position.
You may also drag and drop the panels by right-clicking on the title bar.
The Superalgos Desktop App is an open system, meaning anyone can build layers for the Charting System. So far—with our current limited manpower—we have created several Indicator Layers described below, along with a few Simulation and Execution Layers described further down this document.
Typical candlesticks.
We innovated a bit placing the buy volume at the bottom (in green), and the sell volume at the top (in red).
This is an unusual pattern proving any data set may be plotted on the charts (and by extension, that anything can be added to the system). A Stair Pattern is defined as a set of candles going in the same direction, either up or down. You can think of these patterns as "Candle Channels", as they represent channels with an up or down direction based on underlying candles direction.
A similar concept, this time with volumes. Whenever a sequence of volume bars is found where each one is bigger than the previous one, they are bundled together in a "Stair". The same applies when they are going down (the next is smaller than the previous one). For a trading bot, this serves to identify if sell or buy volumes are raising or declining, if any.
This is the traditional Bollinger Bands indicator. Bollinger Bands have a moving average, in our case calculated with the last 20 periods (the line in the middle of the bands). We are plotting the moving average with one color when it is going up, and with a different color when it's going down. The upper band is at 2 Standard Deviations from the center, pretty much like the lower band, also at 2 Standard Deviations. These are the most widely used Bollinger Bands settings.
This is a well-known indicator that derives from the Bollinger Bands. In a nutshell it tells you how close the price is either to the upper band or the lower band at any point in time. When the price is in the middle of the bands (it is calculated with the close value of each candle), then %B is in the middle of its chart, at value 50. When the price touches the upper band, then %B is at 100, and finally when the price is at the lower band, then %B is at 0.
The chart features lines at %B value 30 and 70 since those are the most common values for traders to forecast when a reversal may happen. In our chart, %B is the one represented at #1. We've found useful to add a moving average in order to smooth volatility a bit, and to be able to ask—at any time—if it is going up or down. The moving average calculated with the last 5 %B values is plotted as line #2. Finally we've also added a property called Bandwidth, which represents the separation of the upper band from the lower band. It is a measure of volatility and is plotted at #3.
This is a non-standard indicator derived from the Bollinger Bands. These types of channels are calculated using the Bollinger Bands moving average. Essentially an upward channel begins when the moving average turns from going down to going up, and the channel finishes when it turns from going up to down. A downward channel starts when the Bollinger Band moving average turns from going up to down, and it finishes when it starts going up again. Upward channels are plotted in green, while downward channels in red. Additional information can be found at the indicator's panel, like the number of periods contained at the channel.
If we consider that one Bollinger Channel can have sub-channels with the same direction (up or down) but different slopes, then we get to the concept of Bollinger Sub-Channels. The most important property of a sub-channel is its slope. The possible values are: side, gentle, medium, high and extreme. With this information, a trading bot could easily ask if it is in a sub-channel with a certain slope and for how many periods.
The Designer organizes the workflow to build strategies following the framework implemented by the Superalgos Protocol. If you are not familiar with the protocol, please read either of the following articles:
-
Superalgos Protocol V0.1 - the Short Version, for Experienced Traders.
-
Superalgos Protocol V0.1 - the Long Version, for Beginner Traders.
The Designer features a visual interface in which all elements encompassing strategies and other concepts are represented by icons organized in a hierarchical structure, as defined by the protocol. The hierarchy starts with Definitions, which in the future may have any number of Trading Systems, which in turn may have any number of Strategies.
Elements are bound to each other in a tree-like structure, and tend to self-organize along the workspace. Dragging and dropping a sample workspace on the Designer is also the fastest way to get started with the Superalgos Desktop App.
The workspace is a concept that refers to all the information available about:
- Definitions, which may include API Keys.
- Trading Systems, their Strategies, and their configurations.
- The position and status of all elements within the Designer, even those which are disconnected from the hierarchy.
Backing up your workspace is the best way to store trading systems, ready to be deployed. Your workspace is saved at the browser level every time you make a change, but still, you should back up your workspace once in a while so that you can go back to past versions.
Definitions include every single parameter describing your Trading Systems, as well as your Personal Data, including API Keys. Your Definitions are saved every time you click RESTART SIMULATION or RESTART LIVE TRADING. You may also save Definitions by clicking Save Changes on its element menu. Unlike the workspace, only elements that are attached to the hierachy belong to the Definitions.
Definitions is the top-level element in the hierarchy, with two children elements: Personal Data and Trading System. We will discuss Personal Data later on, when we cover Live Trading.
A trading system is a collection of strategies that conform to certain parameters.
TEMPORAL LIMITATION: At present, only one Trading System is allowed at a time.
The one parameter that needs to be defined early on is the Base Asset, that is, the asset you wish to stand on when you are out of the market, with no open positions. We will review the rest of the Trading System parameters later on.
| Parameters | Base Asset |
|---|---|
 |
 |
Your Base Asset formula contains the following piece of code, which you may configure to your own needs:
{
"name": "USDT",
"initialBalance": 10,
"minimumBalance": 1,
"maximumBalance": 20000
}
| Variable | Description / Possible Values |
|---|---|
| name | USDT or BTC |
| initialBalance | the amount of capital you wish to allocate to the whole trading system. |
| minimumBalance | when your overall balance combined (balanceAssetA + balanceAssetB) reaches this value, all trading stops; think of this a general safety switch. |
| maximumBalance | a similar concept as the minimumBalance, but on the higher side of the initialBalance. |
Before discussing Working with Strategies, let's review a few basic aspects of the Designer's Interface.
Hoovering the mouse pointer over elements causes a menu to pop up.
The following menu options are tools that will help you manipulate the arrangement of elements, overriding the physics that affect their default floating nature.
The rest of the menu options available in most elements are the following:
Elements in the workspace may be detached from its parent, carrying all children with it. When an element is detached, it is no longer taken into account in simulations or live trading. This feature enables testing different parameters, keeping alternatives handy in the same workspace.
To detach an element, right-click on it and drag it away from the parent element. To attach an element, right-click on it and move it closer to the element you wish to attach it to.
Elements may be attached only to conceptually related parents. For instance, a condition may be attached to a situation, but it can not be attached to a formula.
As the Superalgos Protocol indicates, the definition of strategies is done in stages: Trigger > Open > Manage > Close. We will review each stage, one by one, but let's first discuss the common elements among them.
The Designer provides a Graphic User Interface for traders to input the rules and formulas that determine the behavior of strategies. Traders need to define the rules to trigger on and trigger off each strategy, to take a position, to manage take profit targets and stops.
| Situations | Conditions | Code |
|---|---|---|
 |
 |
 |
The protocol calls these sets of rules situations, in the sense that you are trying to determine what is going on with the market and, if the 'situation' is right, certain actions or events should be triggered.
In other words, you define situations in which you wish a certain event to happen (i.e.: trigger on the strategy, take a position, etc.) and each situation is described as a set of conditions that need to be met in order for the event to be triggered.
The type of statements you will use to define conditions need to evaluate to true or false.
When all conditions within a situation evaluate true, then the situation evaluates true. This means that multiple conditions within a situation are evaluated with the AND operator (e.g. condition 1 AND condition 2 AND condition 3 are either true or false; that is, if one condition is false, then the situation is false).
On the other hand, when a certain event has multiple situations, then situations are evaluated with the OR operator (e.g. if either situation 1 OR situation 2 are true, then the event will be triggered.
This set up of conditions and situations allows to take the same kind of action (trigger a certain event) upon the occurrence of different desireable scenarios, each described by one situation.
Put in other words, events may be triggered in different circumstance, meaning that you are free to define different situations upon which the event would be triggered. In such case, when any of the situations evaluate true, then the event shall be triggered.
In order to define conditions you will use statements using any of the available variables that describe what is happening with the market. Remember, conditions need to evaluate either true or false.
To create such statements you will use comparison and logical operators:
| Operator | Description |
|---|---|
| === | equal value and equal type |
| != | not equal |
| > | greater than |
| < | less than |
| >= | greater than or equal to |
| <= | less than or equal to |
| && | and |
| ∣∣ | or |
For example:
Situation 1
- Condition A: candle.close > bollingerBand.MovingAverage
- Condition B: candle.previous.max > bollingerBand.MovingAverage
In the example above, conditions A and B are comparison statements that may evaluate either true or false. In the case both would evaluate true then Situation 1 would be true as well.
Situation 2
- Condition C: candle.max <= 2000 && candle.min >= 1000
In the example above, condition C would be true if the whole candle falls within the range between 1000 and 2000. If this is true, then situation 2 is true as well, as there is only one condition to check.
In addition to the explanations available here, a comprehensive video tutorial for building strategies is available in our YouTube channel. The video is slightly outdated in that it doesn't take transaction fees into account when running simulations. Also, the Superalgos Desktop App (the client version of the Platform) does not feature a menu on top. Otherwise, the content is still valid.
Strategies within a specific Trading System respond to the parameters set for the corresponding Trading System. This means they all have the same Base Asset, and they all share the initialCapital (see Trading System for further references).
To start a brand new strategy, go to the Trading System icon and click Add Strategy on the menu. Several icons will pop up on the screen. As you work on each stage (Trigger > Open > Manage > Close), you may need to add the missing items corresponding to certain elements.
Let's review the minimum requirements for having a working strategy:
| Icon | Element | Description |
|---|---|---|
 |
Position Size | A formula, determines how much capital is put in each trade. The formula may be a constant (a fixed numerical value), or may relate to relevant available variables. The resulting value should not be higher than your available balance (balanceAssetA if you stand on BTC and balanceAssetB if you stand on USDT). e.g.: assetBalanceB puts all your available balance in each trade, in case your base asset is USDT. |
 |
Position Rate | A formula, at this point, not taken into account during live trading. We recommend you use candle.close in your formula until the Execution Engine allow users more control over execution (learn more about current Execution Limitations). |
In addition to Position Rate and Position Size, you also need to define the initial values for your Stop and Take Profit. The initial value is set as a formula on Phase 0 (refer to the Superalgos Protocol articles for an explanation on managing Stop and Take Profit in phases).
Thanks to the implementation of the Superalgos Protocol, all strategies built within the Superalgos Desktop App are portable. This means that people may use strategies built by other people or groups of people.
You may import any element—formulas, conditions, situations, phases, stages, complete strategies, complete trading systems and even complete workspaces—simply by dragging and dropping them on the workspace.
candle.min: The minimum price of the last closed candle (low).
candle.max: The maximum price of the last closed candle (high).
candle.open: The price at which the last closed candle opened.
candle.close: The price at which the last closed candle closed.
candle.direction:
"Down": candle.close < candle.open (bearish candle)"Up": candle.close > candle.open (bullish candle)"Side": candle.close = candle.open (neutral candle)
candle.previous: Refers to the previous candle. You may use candle.previous to fetch any of the variables of the previous candle (i.e.: candle.previous.close). You may also use as many .previous modifiers as required to fetch values of more than one period behind the current one (i.e.: candle.previous.previous.max returns the maximum value of two candles before the current one).
Previous Property: The .previous property is a property common to all indicators. You may use the property on each of the indicators in a similar way.
bollingerBand.movingAverage: The value of the current moving average (20 periods).
bollingerBand.standardDeviation: The value of current the standard deviation.
bollingerBand.deviation: bollingerBand.standardDeviation * 2
bollingerBand.direction:
"Down": bollingerBand.previous.movingAverage > bollingerBand.movingAverage"Up": bollingerBand.previous.movingAverage < bollingerBand.movingAverage"Side": bollingerBand.previous.movingAverage = bollingerBand.movingAverage)
bollingerBand.previous: Use .previous like with candles (see candle.previous above).
Learn more about the Bollinger Band
percentageBandwidth.value: A numeric value between 0 and 100; the current value of the percentage bandwidth.
percentageBandwidth.movingAverage: A numeric value between 0 and 100; the current value of the percentage bandwidth moving average.
percentageBandwidth.bandwidth: A numeric value between 0 and 100; the current bandwidth.
percentageBandwidth.direction:
"Down": percentageBandwidth.previous.movingAverage > percentageBandwidth.movingAverage"Up": percentageBandwidth.previous.movingAverage < percentageBandwidth.movingAverage"Side": percentageBandwidth.previous.movingAverage = percentageBandwidth.movingAverage)
percentageBandwidth.previous: Use the .previous property like with candles (see candle.previous above).
bollingerChannel.direction: Possible values are "Down", "Up", and "Side".
bollingerChannel.period: The number of periods the channel spans at the moment the variable is being read. For instance, if a channel spans 10 candles and the variable is checked on the fourth candle, then bollingerChannel.period = 4. Put in other words, it is the current span of the channel.
bollingerSubChannel.direction: Possible values are "Down", "Up", and "Side".
bollingerSubChannel.period: The number of periods the sub channel spans at the moment the variable is being read. For instance, if a sub channel spans 10 candles and the variable is checked on the fourth candle, then bollingerChannel.period = 4. Put in other words, it is the current span of the subchannel.
bollingerSubChannel.slope: Indicates how steep the slope of the sub channel is. Possible values are "Side", "Gentle", "Medium", "Steep", "Extreme" (in order from lowest to highest).
strategyStage: Possible values are "No Stage", "Trigger Stage", "Open Stage", "Manage Stage", and "Close Stage".
stopLoss: The value of your Stop in the active phase.
stopLossPhase: The number of the active Stop phase (0, 1, 2, ...).
takeProfit: The value of the Take Profit in the active phase.
takeProfitPhase: The number of the active Stop phase (0, 1, 2, ...).
positionRate: The price at which the position was taken.
positionSize: The size of the position.
balanceAssetA: Your BTC balance.
balanceAssetB: Your USDT balance.
lastTradeProfitLoss: The P&L value for the latest completed trade (roundtrip).
lastTradeROI: The ROI of your latest trade.
profit: The total P&L during the current execution period.
roundtrips: The total number of trades in the current execution.
fails: The number of trades resulting in losses in the current execution.
hits: The number of trades resulting in profits in the current execution.
periods: The number of candles evaluated in the current execution.
positionPeriods: The number of candles in the current open position.
positionDays: The number of days in the current open position.
distanceToLast.triggerOn: The number of periods between the last Trigger On and the current candle.
distanceToLast.triggerOff: The number of periods between the last Trigger Off and the current candle.
distanceToLast.takePosition: The number of periods between the last Take Position and the current candle.
distanceToLast.closePosition: The number of periods between the last Close Position and the current candle.
A simulation is a combined backtesting plus paper trading operation, meaning that the simulation may run over both historic and up-to-date, live data. All actions performed by strategies are plotted directly over the charts, as explained in the Private Layers section.
In order to run a first simulation, you need to have a strategy in working order, as described in the Starting a Strategy from Scratch section.
Fees are a crucial part of the game. A strategy may work like a charm when you leave fees out of the equation but would lead you to bankruptcy in a live trading situation.
Simulations take fees into account when the following piece of code is present and properly configured in your Fee Structure parameter:
| Parameters | Fee Structure |
|---|---|
 |
 |
{
"maker": 0.15,
"taker": 0.25
}
The above configuration corresponds to standard Poloniex maker and taker fees. Remember, for the time being, all orders placed by the Execution Engine are market orders, thus, the taker fee applies in all cases.
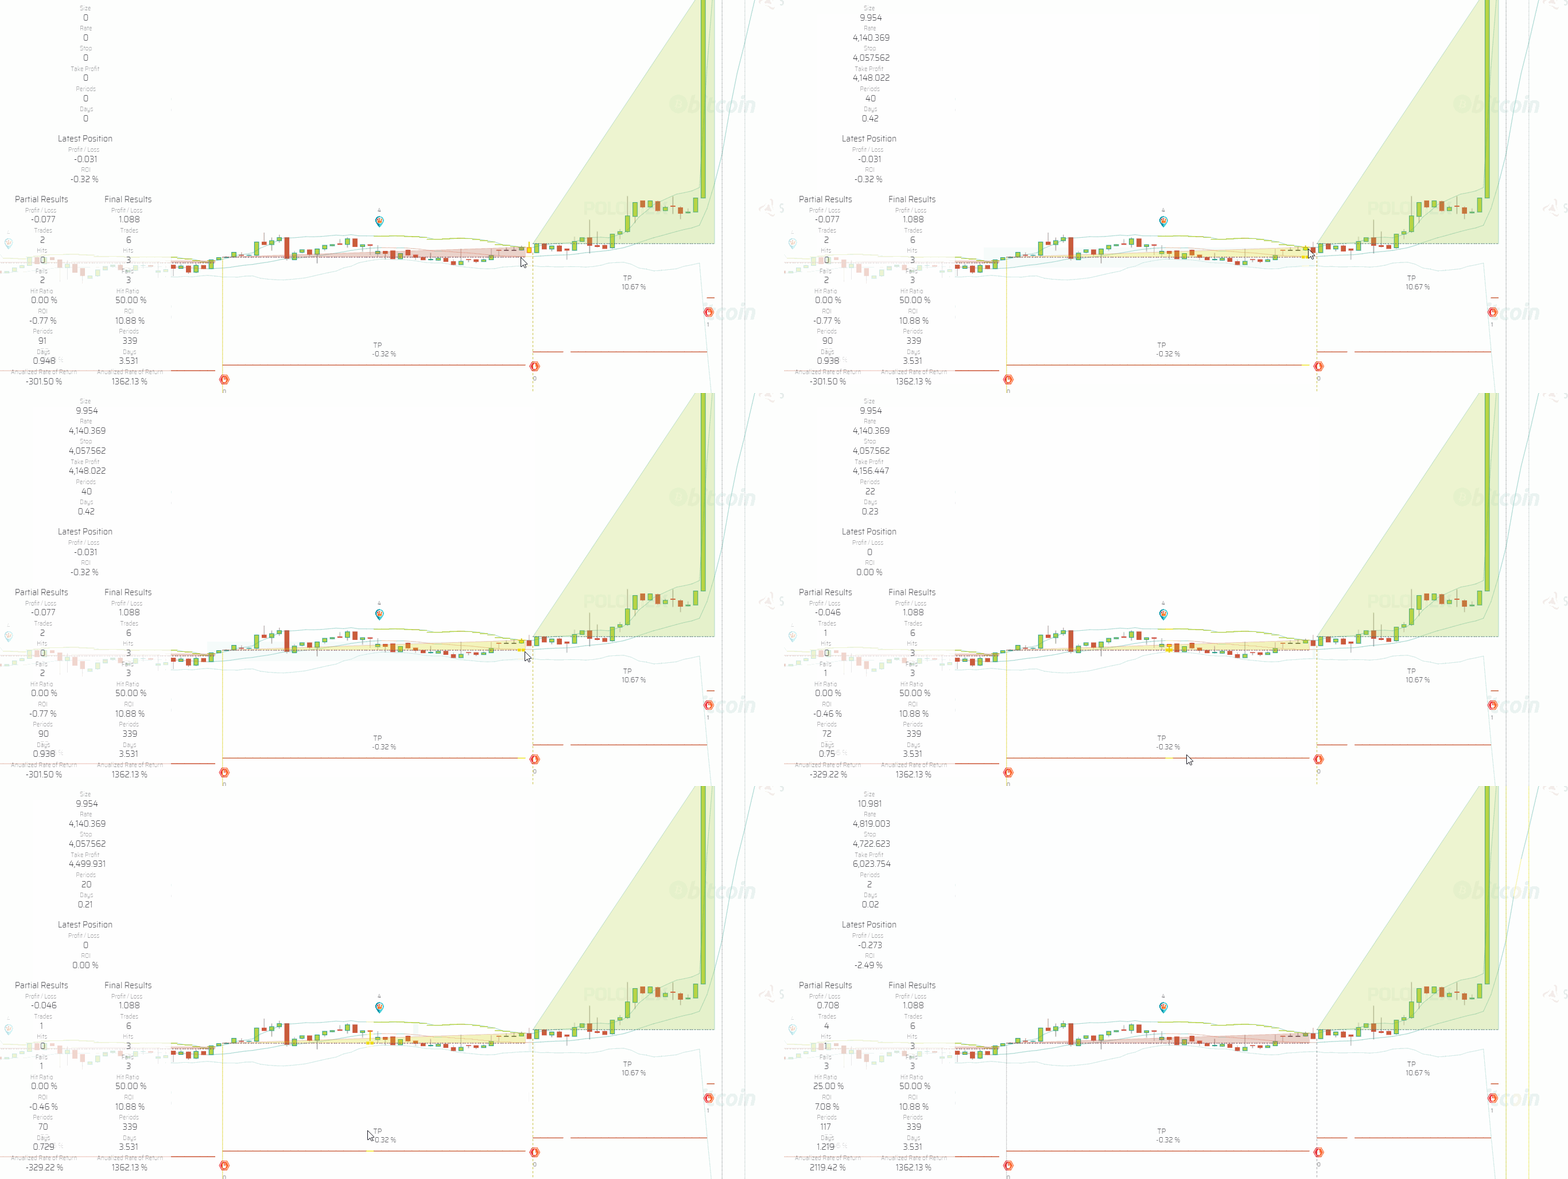
To illustrate how fees affect your bottom line, take a look at the image below.
The trade hits the take profit target above the Position Rate level, however, due to fees, the trade has a negative 0.32% ROI.
If the Fee Structure parameter is left empty or disconnected from your Trading System, fees will not be computed during simulations.
Slippage is another issue you need to be aware of to more realistically evaluate a Strategy. The price at which the Exchange will fill the order placed by the Execution Engine is seldom going to match the conditions of the simulation.
To account for slippage during simulations, you may enter slippage values for the three different occasions in which the Execution Engine will place orders: Take Position, Take Profit and Stop.
| Parameters | Slippage |
|---|---|
 |
 |
Find the Slippage parameter under your Trading System and enter the desired values for each of the below:
{
"positionRate": 0.1,
"stopLoss": 0.2,
"takeProfit": 0.3
}
The number you enter is applied as a percentage of the price of the order and added or substracted from the price depending on the circumstances, always working against you. For instance, "positionRate": 0.1 means the position will be set at a price 0.1% higher if you stand on USDT or lower if you stand in BTC.
The result of slippage in simulations is taken into account by the graphic representation of each trade created by the Simulation Trades layer.
If the Slippage parameter is left empty or disconnected from your Trading System, slippage will not be computed during simulations.
| Parameters | Time Range |
|---|---|
 |
 |
The Datetime Range parameter of your Trading System is used to control the period of time in which the simulation will be calculated. Depending on how you set up this parameter you will be either backtesting, paper-trading, or both at the same time.
1. Backtesting:
A. To backtest a specific period of time in the past, introduce an initialDatetime and a finalDatetime:
{
"initialDatetime": "2019-09-01T00:00:00.000Z",
"finalDatetime": "2019-09-25T00:00:00.000Z"
}
B. If you set a finalDatetime in the past but not an initialDatetime, then the simulation will start at the point in time the charts are at when you click the START BACKTESTING button. That is, the initialDatetime is taken from the position of the charts.
2. Paper-trading:
A. To do a forward-test, enter the current date as the initialDatetime and the date up to which you wish to run the forward-test as the finalDatetime.
B. If you do not enter a finalDatetime, then the forward-test will run for one year.
Simulations run in the time period active at the moment of clicking the RESTART SIMULATION button. Only one time period may be active at any point in time: if you run a simulation in a different time period than a previous simulation, the previous one stops—however, the previous simulation data is conserved and may be accessed again by going back to the corresponding time period.
When building your conditions and formulas, you may want to include analysis concerning a different time period than the one in which you intend to run your simulation and live-trading.
The Available Variables explained above, written as described, always refer to the time period on which the simulation or live-trading is running. To refer to other time periods, you need to use a mechanism built-in the app, implementing the following syntax:
chart.at + time period + . + your variable
For example:
chart.at04hs.candle.close > chart.at04hs.candle.previous.close
The above statement compares the current 4 hours candle to the previous 4 hours candle, no matter what time period you are simulating in.
| Time Period | Syntax |
|---|---|
| 1 min | chart.at01min. |
| 2 min | chart.at02min. |
| 3 min | chart.at03min. |
| 4 min | chart.at04min. |
| 5 min | chart.at05min. |
| 10 min | chart.at10min. |
| 15 min | chart.at15min. |
| 20 min | chart.at20min. |
| 30 min | chart.at30min. |
| 40 min | chart.at40min. |
| 45 min | chart.at45min. |
| 1 h | chart.at01hs. |
| 2 hs | chart.at02hs. |
| 3 hs | chart.at03hs. |
| 4 hs | chart.at04hs. |
| 6 hs | chart.at06hs. |
| 8 hs | chart.at08hs. |
| 12 hs | chart.at12hs. |
| 24 hs | chart.at24hs. |
TECHNICAL LIMITATION: When you are simulating and live-trading on time periods in the order of minutes (below 1 hour), you may access any other time period variables, as explained above. However, when you are simulating or live-trading in time periods of 1 hour and above, you may only access data of time periods of 1 hour and above.
Once you run a simulation, it keeps running for as long as the node.js processes are running at the console. When the simulation reaches the present time, it remains active, calculating dynamically as new data is retrieved from the exchange.
If you click RESTART SIMULATION, processes are stopped and restarted. This results in past simulation data for the same time period being deleted and new data being written as the calculations advance.
The simulation process is associated to the Definitions structure present at the moment of running the simulation. Changes you make in your Definitions afterwards are only taken into account when you restart the simulation.
All of these considerations apply for Live Trading as well.
Back on the Charts, the following layers plot strategies' actions over the market data, providing a comprehensive set of visual clues showing how strategies would behave when trading.
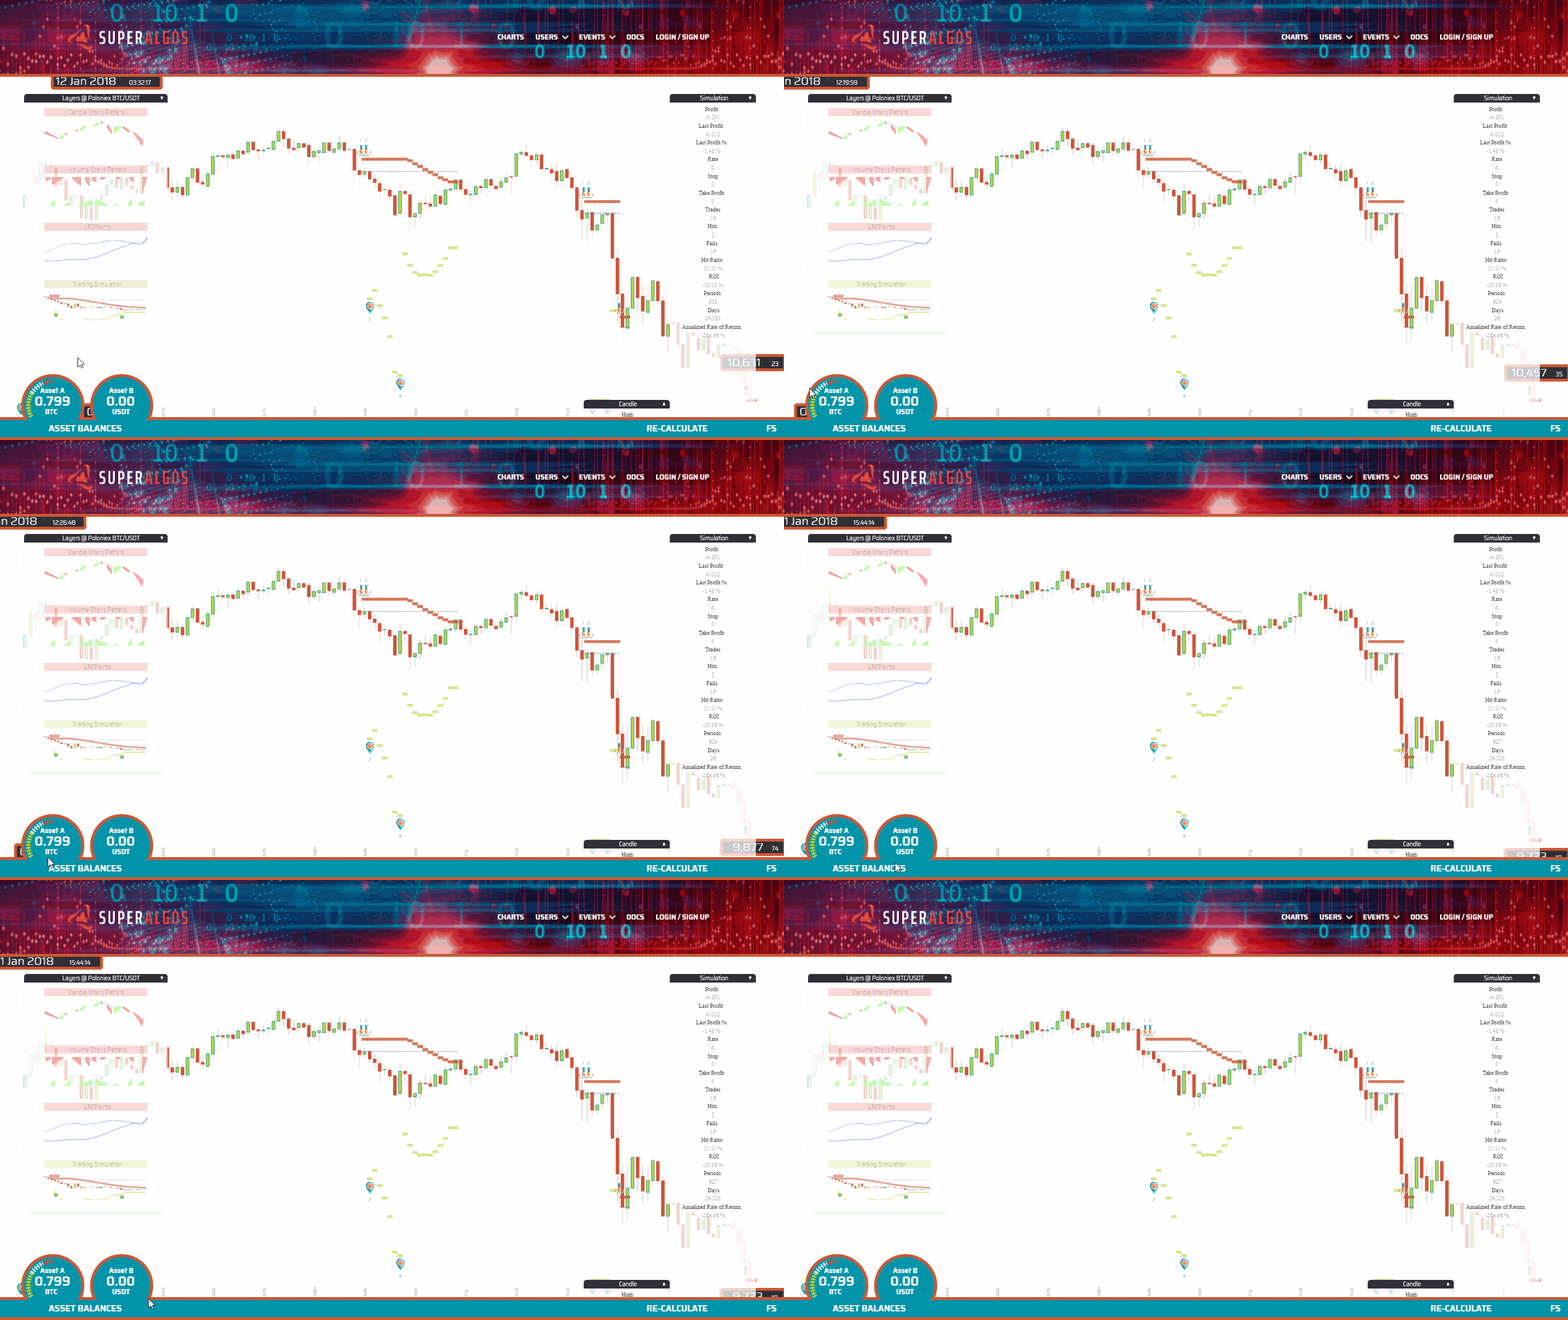
The Trading Simulation layer displays a backtest + forward test (paper trading) of whatever strategies you have created in the system. At sign up, you are provided with an initial set of strategies so that you can be up and running as quickly as possible. By activating the Trading Simulation layer you should be able to see something like this:
Notice Asset Balances in the bottom left corner of the screen. Asset A is your base asset.
The dashed line represents the duration of the trade at the price of the take position event. Notice how the base asset is exchanged for Asset B and back to the base asset as the trade closes.
Notice the green horizontal bars indicating the take profit value for each period (candle). Take profit is managed in phases, marked with the corresponding icons.
Notice the red horizontal bars indicating the stop value for each period (candle). Stop is managed in phases, marked with the corresponding icons.
The Trading Conditions layer helps identify which conditions are met at each candle. Notice how conditions are highlighted as the cursor moves through different candles.
The Simulation Strategies layer identifies trigger on and trigger off events, signaling the activation and deactivation of strategies.
The Simulation Trades layer marks trades with a triangle whose hypotenuse connects the price at the take position event with the exit price. When the trade is profitable, the triangle is green; when the exit happens at a loss, the triangle is red.
Once you are happy with your strategy, running it as a fully automated bot to trade live is quite simple. Truth be told, your strategy running as a simulation is pretty much a trading bot already—only that orders don't go to the exchange.
All you need to do to start live-trading is:
-
Get your API Keys from the exchange (see instructions for Poloniex).
-
Enter the public key and secret in the Account Key element attached to the Exchange Account element. Simply replace the New Key title with the public key, and enter the secret as the Key Value.

-
Make sure the following elements are present in your strategy. If they are not, simply add them: go to the Open Stage element and select Add Open Execution on the menu; do the same with the Close Stage, adding Close Execution). No need to configure anything, simply make sure the elements are there).
| Icon | Element | Stage |
|---|---|---|
 |
Open Execution | Open Stage |
 |
Close Execution | Close Stage |
- Go back to the Charts and make sure they are positioned in the time period you wish to trade in.
WARNING: The Superalgos Desktop App is at a very early stage of development. As such, errors may occur at any point, including errors that can cause you to lose money. You are responsible for taking all precautions before starting trading live. Make sure you test with small amounts of money, the kind you can afford losing. Also, make sure you understand the Execution Limitations. Trade live at your own risk.
- Click RESTART LIVE TRADING.
As soon as you click RESTART LIVE TRADING, your bot will be trading live. What happens is that you are still running a simulation—thus all the simulation layers keep plotting the same kind of information over the charts.
The difference is that orders will now go to the exchange.
Your trading bot is executed every 30 to 60 seconds, depending on the capacity of your machine. This is something you need to consider when picking a time period to trade, as the time lag between the moment the candle closes at the exchange and the time your trading bot is executed, will be more or less significant.
In addition to the simulation layers, you will now be able to use the Live Trading History layer to get information about your trades.
The layer plots tiny orange circles to indicate the precise point in time and price of each execution of the bot.
When a buy order is successfully placed and filled at the exchange, a green triangle pointing upwards is drawn on the screen. The lower tip of the triangle signals the point in time and rate of the order.
When a sell order fills, a red triangle is plotted over the charts.
TEMPORARY LIMITATION: When live-trading, the simulation layers do not currently reflect the actual live trades, but the simulated ones.
At the current stage of development, users have no control whatsoever over the execution of orders.
The way execution works at this stage is quite basic: once conditions are met for taking a position, or once a take profit or stop target is hit, one single market order is placed at the exchange.
When taking a position, the Take Position price shown in simulations is defined by the formula you use in your Open Stage > Position Rate > Formula.
However, this is overridden during live-trading, and replaced with a market order.
When taking profit or hitting a stop, that is, when attempting to close a position, the price in simulations is determined by the intersection of the corresponding candle with the values resulting from the active take profit and stop phases formulas.
However, during live-trading, once a take profit or stop target is hit, the order to close the trade is placed as a market order.
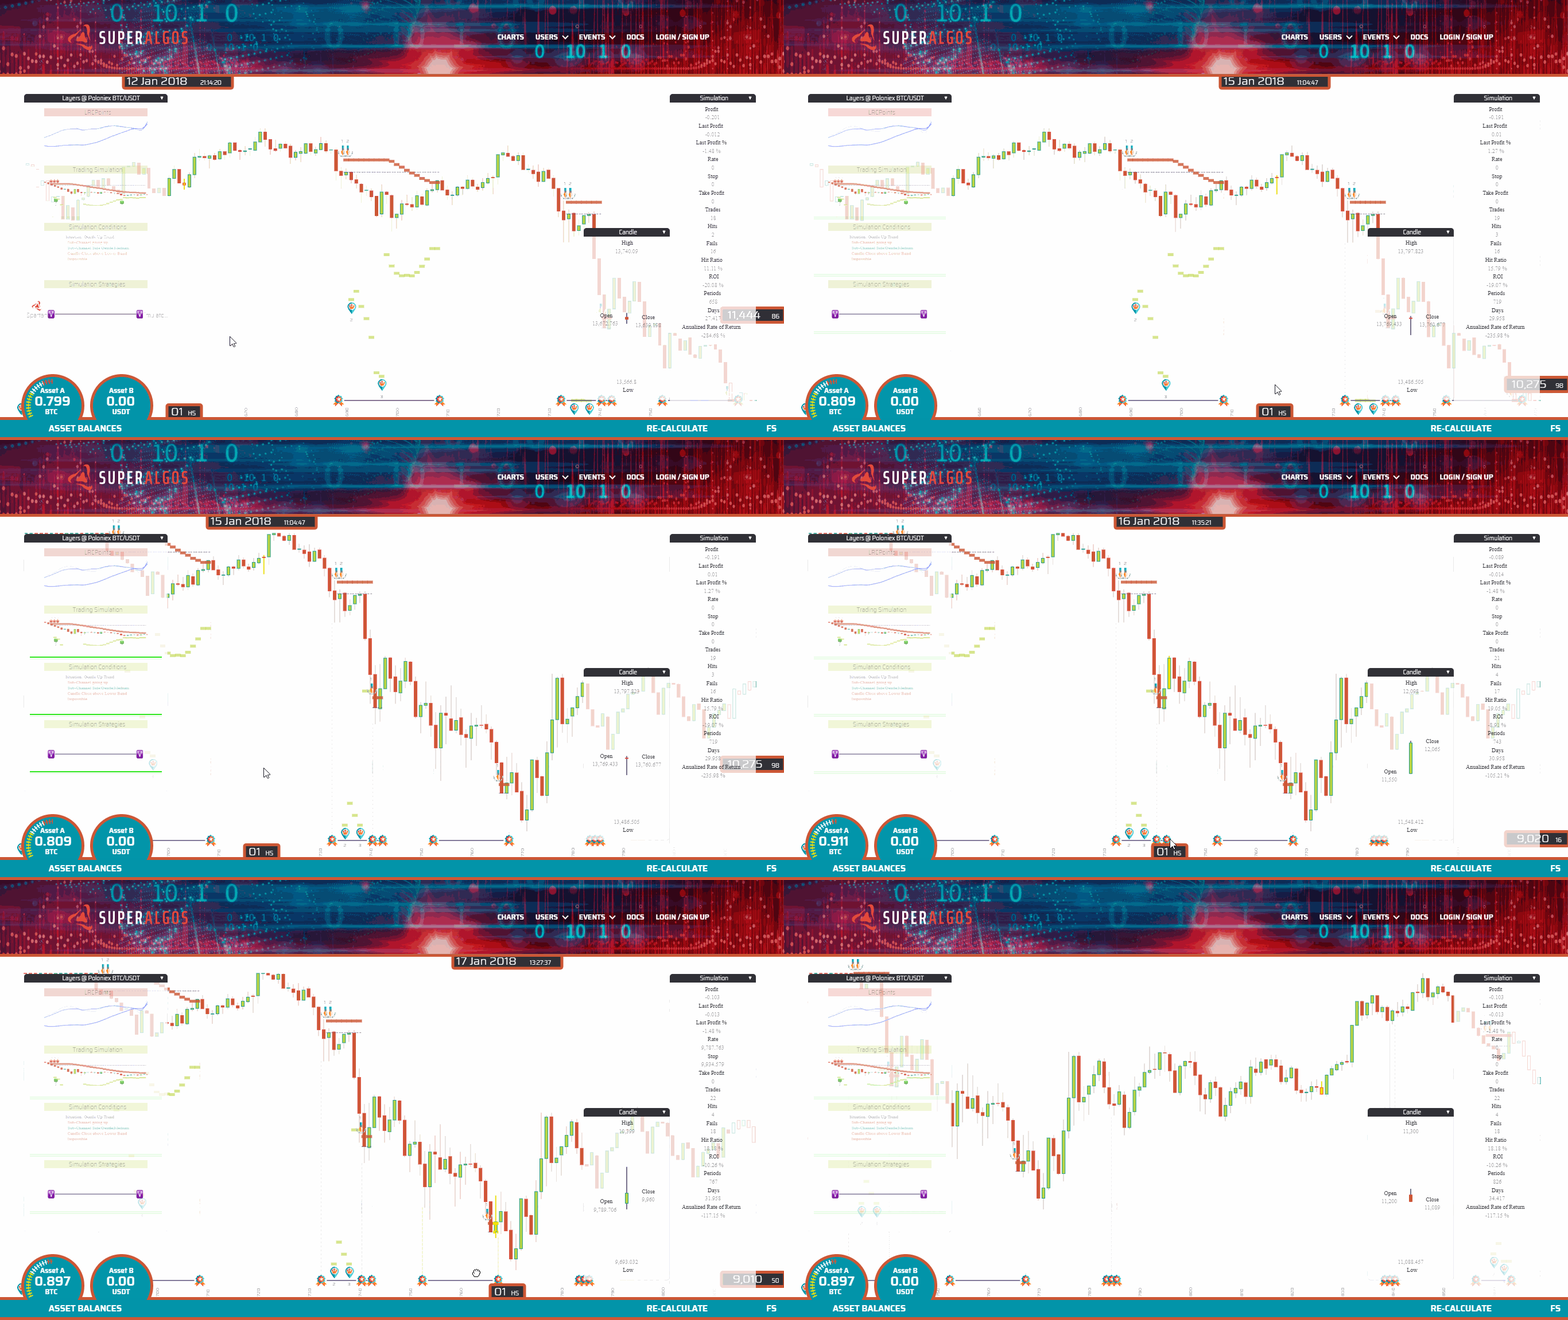
Let's quickly review one of the implications these limitations may have, with an example:
The image above, featuring 10-minutes candles, shows a sudden drop in price. As you may see, there where only three executions of the trading engine during the price drop.
Had there been a stop somewhere in the range of the sudden price drop, chances are that the price would trigger the stop in-between executions. This means that the engine would place the sell order some time after the price hit the stop, and the order would fill at a price lower than intended.
An additional limitation is that there currently is no feature to break up orders, therefore, the size of your orders and the likeliness of them getting filled depend on the liquidity of the market/exchange.
It is important that you fully understand the implications of these limitations if you are considering to trade live with the app at this stage, as you will need to adapt to the current state of affairs.
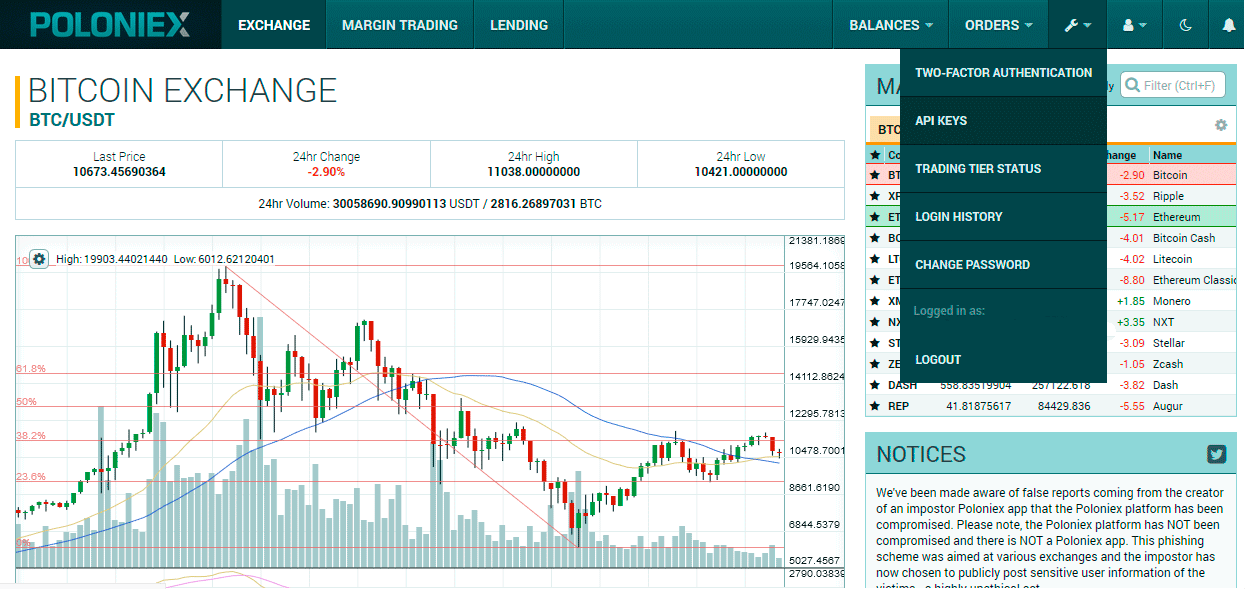
This is how you create an API Key in Poloniex:
Go to the tools menu and select API KEYS...
If you have never used the API before, chances are it is disabled at the exchange. So before actually creating an API Key you will need to enable them...
You will need to follow the validation process involving checking your email and confirming your choice. Once that is taken care of, go back to the tools menu and click API KEY again. You should now see a screen offering to create a new key...
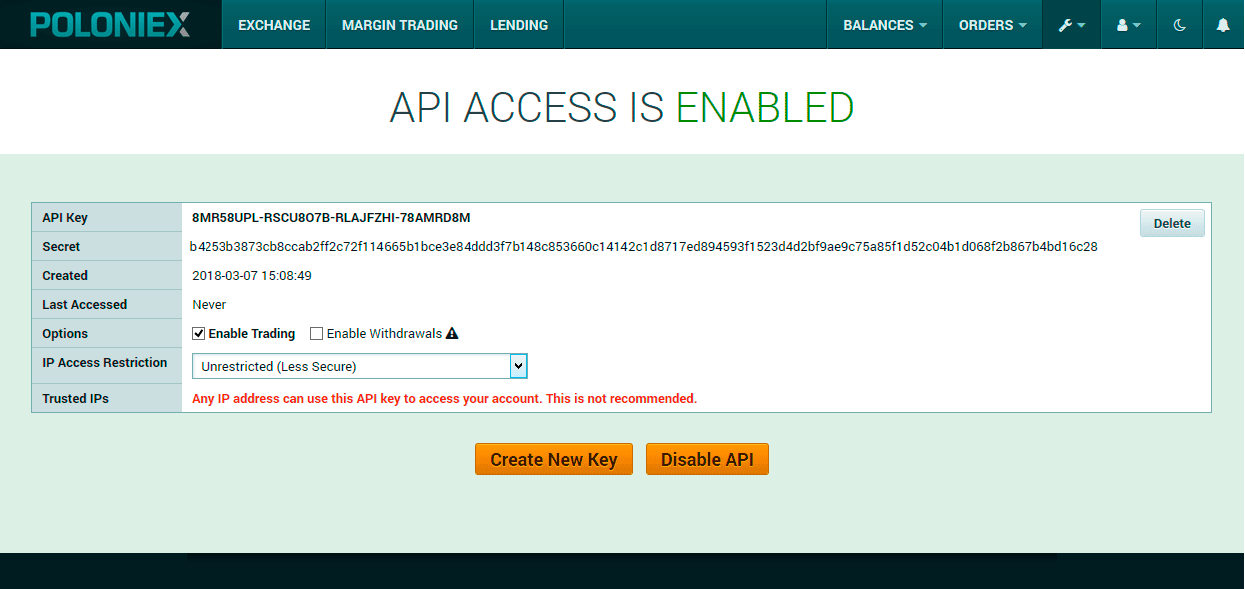
Once you create your key, the system will present it as follows...
Make sure you DO NOT enable withdrawals nor IP access restrictions.
Copy the secret to use it in the Superalgos Desktop App. Once you leave this screen, recovering your secret requires an email validation process.
For the time being, the app does not allow having multiple trading systems under your Definition, however, you may have more than one Definition in your Workspace. This may also be useful is you wish to use different API keys for different strategies.
To add a Definition, drag and drop a Definition file, and select Run in the menu, setting the execution focus on the new Definition, as indicated by the white ring surrounding the Definition element.
It may happen that your simulation or live trading is not working as expected. The first thing to do in such case is look around within your workspace. Errors are signaled with a red circle surrounding the relevant element of the workspace. Hoover the mouse pointer over the element and you should get a description of what may be that is causing the unexpected behavior.
Bear in mind that when the split tab is fully closed, errors will no longer show up in the Designer, as shown in the below video:
If you are running the app for the first time or you stopped running the app for some time, data will not be up to date. Every time you start the app, it will take some time for data to catch up with the present time. If you wish to make sure your bots are running, simply click RESTART SIMULATION, check if the processes are running in your console and eventually, refresh the concerned layers.
When you are working with a strategy, changing conditions, formulas or any other parameters, you will likely be re-running simulations (RESTARTING BOTS) so that the bots take on the new settings. Every time you RESTART SIMULATION, the system waits for a little while and automatically refreshes the Simulation Layers. However, it may happen that the auto-refresh happens before the new data is made available by the bots, so you may wish to refresh the Simulation Layers manually if that seems to be the case.
We highly appreciate bug reports. This is what you need to do:
-
Make sure you are running the latest release and that you have upgraded to the latest patch. You may find information about releases and patches in the releases page. If you are not running the latest patch, please upgrade and test your issue again before reporting anything.
-
Go to the Issues page in this repository and take a moment to search for similar existing open issues. If you find someone has the same issue as you, you may find helpful to follow the thread and comment if you have any new information about the issue.
-
If there are no similar issues, then open a new one. Do your best to describe the problem as thoroughly as possible.
Developers will be interested in knowing how to reproduce the issue in their own systems, so please describe the process that leads to the issue as clearly as possible. Capturing a GIF video showing the steps that lead to the issue would be of great help! LICEcap is a lightweight, simple app that can help you with that. If developers can reproduce the issue, half of the problem is solved already.
If the issue seems to happen under specific conditions, you might want to share your Definitions with developers. To do this, go to the Definitions element in your workspace and select Share in the menu. A file containing your strategy and other parameters, but NOT your API keys, will download to your browser's download folder. Upload this file to the issue only if you feel comfortable with sharing it openly. If not, then wait for developers to contact you.
Please make sure you enable Github notifications when someone responds to the issue, as developers may want to ask questions.
If the issue happens while using the app at the browser, then please include a screen capture of Chrome's Console. Open DevTools with the F12 key (when the browser is in focus) and click the Console tab, then go back and reproduce the issue. Take a screen capture of the Console and paste it along with your report.
Feel free to also include screen captures of the app itself if there is anything relevant you wish to show to developers.
The Superalgos Desktop App is the client implementation of the Superalgos Platform—a larger system that will eventually include the implementation of a peer-top-peer network hosting a Collective Trading Intelligence.
The App is built out of three main components: AAWeb, CanvasApp, and CloneExecutor.
These Node.js components provide the infrastructure required to run different kinds of algorithms or bots:
-
Sensors: extract raw trades data from exchanges and store it in a standardized format in the form of a JSON file.
-
Indicators: process the output of sensors and other indicators to produce more elaborate data sets.
-
Plotters: create visual representations of data sets to render the information in a human-friendly manner, most likely over the charts.
-
Simulation and Trading Bots: read a Superalgos Protocol file containing the details of trading strategies and interact with the Superalgos Desktop App to run them as simulations (using a simulation plotter) or to trade live.
When you click the RESTART SIMULATION button, several bots are executed in a specific order, taking into account dependencies, as defined in the CloneExecutor\sequence.json file. These processes run in a loop, retrieving data from the exchange, producing indicators, running simulations and trading live—online.
Bots mission is—in essence—creating products that others can consume. To do this, they run processes which produce and store data sets.
Each bot may have several processes, and processes don't necessarily have a one-to-one relationship with products. That is, a product can be the result of the work of one or more processes.
Bot processes run when called by the app and stop when they finish the task at hand, to wake up again only when the sequence is completed and a new round of executions starts.
The data sets processes create are the actual output of bots which are stored in the file system. But processes also produce and store a second valuable piece of information: status reports.
Status reports serve as temporal annotations that bots read every time they are called by the app to know what was done in the previous run and what the state of affairs is at present. Status reports are dynamic, and they change constantly, with updates after every single run of the associated process.
We established that bots produce products for others to consume. This others include other algorithms, meaning that bots usually depend on the data sets produced by other bots. We call these data dependencies, which are declared on each bot configuration file.
Bots consume their own status report and they might as well consume status reports from other algorithms. We call these status dependencies, which are too declared in each bot configuration file.
At this point, there are five different types of data sets: market files, daily files, minutes files, single file, and file sequence. These types of data sets define the structure of the data and how it is stored.
A market file contains data spanning the whole existence of the market, that is, from the day the pair (e.g. USDT-BTC) started trading up to the present time. The data is stored in one single file, which is appended every time the process runs generating new data.
A daily file contains data segmented by day. That is, the process generates one file per day and stores it in the deepest level of a folder tree structure of the following type: Year > Month > Day.
A minutes file contains data corresponding to one single minute and is stored in the deepest level of a folder tree structure of the following type: Year > Month > Day > Hour > Minute.
A file sequence consists of sequential information that is not necessarily structured on any particular timeframe. The process stores two types of files: the one ending in .Sequence.json contains the number of files in the sequence, and the sequence is formed by multiple files ending in a sequential number (e.g. 15.json). A single file is pretty much just that: a data set that is stored in one file only.
Let's put all this in perspective by analyzing the processes, products, and dependencies of a few existing bots.
Charly is a sensor. As his README explains, he gets both historic and live trades data from exchanges and assures consistency using recursive processes before storing it in a highly fragmented and usable data set.
Charly offers one product which is defined by the data set scope and various characteristics. Charly has three different processes: Live-Trades, Historic-Trades, and Hole-Fixing. These three processes combined generate the one single data set that constitutes Charly's single product.
The data set is stored under the minutes file structure.
Now, let's see what Bruce, an indicator, does with Charly's product. As you can learn from Bruce's README, he produces two data sets: candles at 1-minute resolution and volumes at 1-minute resolution. The data sets are stored under the daily file type of data set.
Now scroll down the README file and see what Bruce's dependencies are. That's right! Bruce depends on Charly's product. Bruce's processes take the trades data that Charly extracted from the exchange, performs calculations to build 1-minute candles and stores his data set with more elaborate data.
In other words, Bruce is adding value to Charly's product and offering a new value-added product of his own. But the value-adding chain does not stop there...
Let's take a look at another indicator, Olivia. According to her README, Olivia offers four different products: candles at sub-hour resolutions, candles in resolutions above one hour, volumes in sub-hour resolutions and volumes in resolutions above one hour. And guess what? Indeed, Olivia uses Bruce's 1-minute candles and 1-minute volumes to produce complementary candles and volumes at different resolutions.
Tom uses candles from Bruce and Olivia to produce the candle-stairs pattern data set described in the Candle Stairs Patterns layer.
Chris uses Olivia's candles to produce the Bollinger Bands indicator.
Paula uses Chris' Bollinger Bands data set to build the Bollinger Channel indicator.
The last link in the chain usually comes in the form of user strategies handled by the simulation and trading engine—Jason—consuming data from indicators to make trading decisions.
Of course, the main goal of a strategy is to perform profitable trading. However, notice that Jason has outputs too:
-
Trading-Simulation, Simulation-Strategies, Simulation-Trades, and Simulation-Conditions, are data sets that the Trading Simulation Plotter reads to create a visual representation of strategies' actions over the charts.
-
Live Trading History, Trading-Execution and Trading-Process are data sets used to render live-trading activity over the charts.
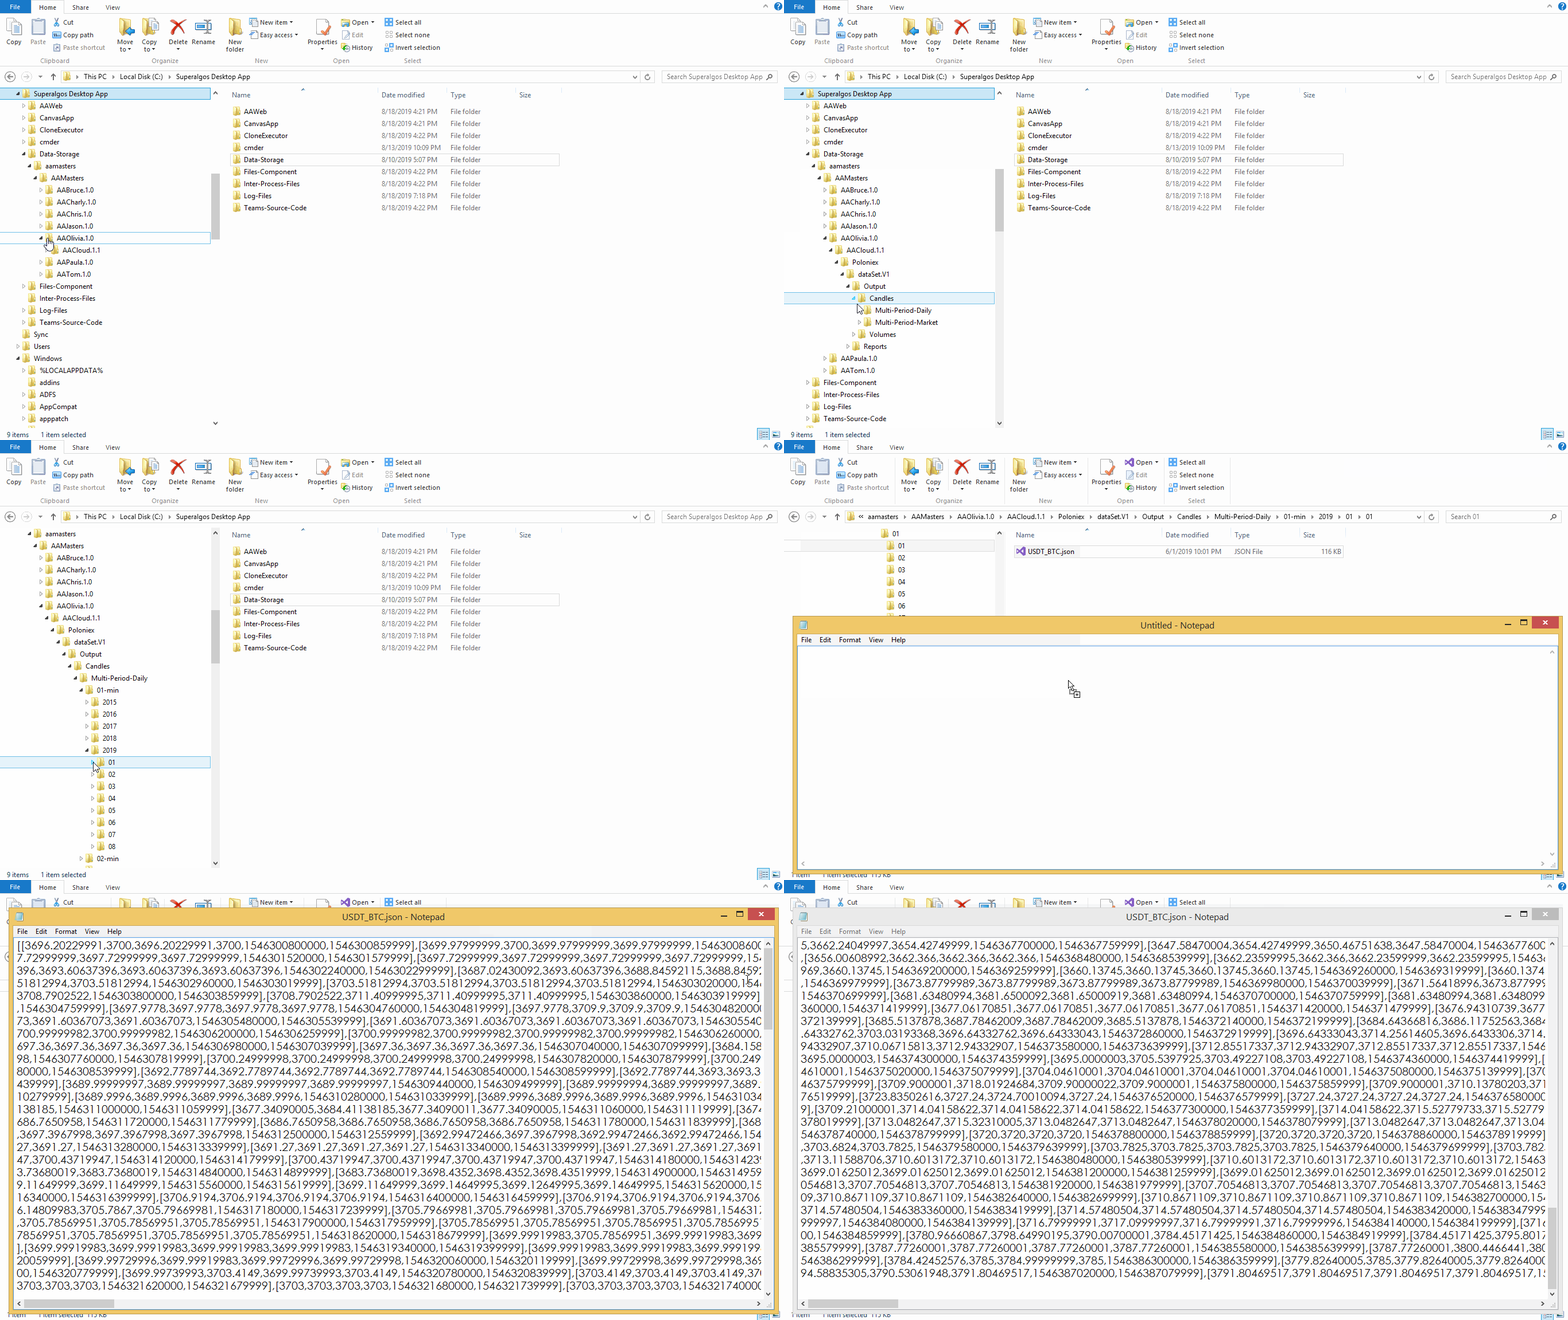
Each of these bots produces an output in the form of JSON files, which are stored under the \Data-Storage\aamasters\AAMasters folder, sorted by bot.
The route for writting bot's output is built as follows:
Bot Name and version > the version of AACloud (an internal platform component) > the version of the data set > Output folder
e.g.:
\AAOlivia.1.0\AACloud.1.1\Poloniex\dataSet.V1\Output
The format in which bots store their output is standardized. In an attempt to make data highly accessible, a tree-like folder structure is built following this pattern (which may slightly differ from bot to bot, depending on the specific data set):
Data Set Name > Process Name > Time Period > Year > Month > Day > Hour
e.g.:
\Candles\Multi-Period-Daily\01-min\2019\08\15
In addition to outputting a data set, bots also store a Status Report. These reports keep crucial information that allows the same and other bots know what happened in the previous execution.
Status reports are stored in the Reports folder, at the same level in the structure as the Output folder.
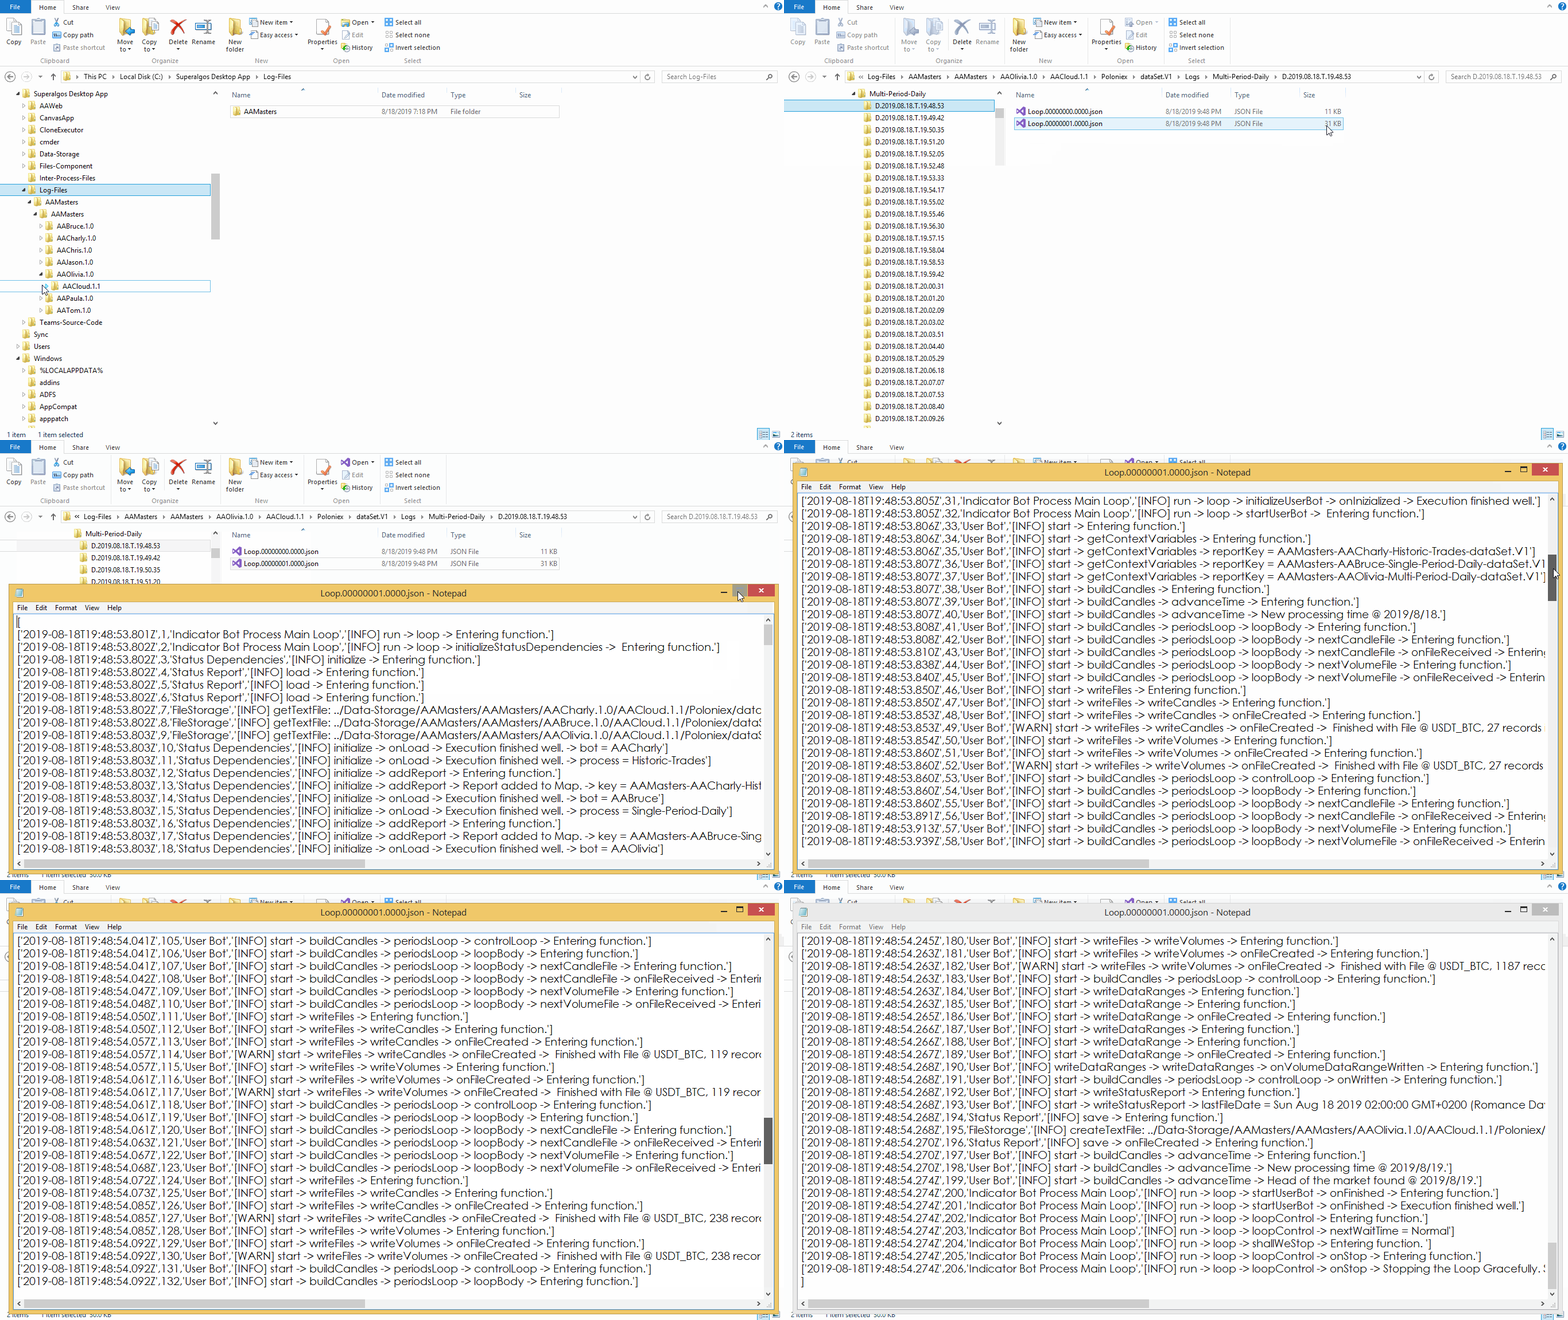
Each bot keeps its own set of log files, stored under a similar folder structure as bot's Output and Reports. The difference is that the Log-Files folder is at the root level of the release folder, instead of being inside Data-Storage:
\Log-Files\AAMasters\AAMasters
Log files contain detailed information about each execution of the bot. As such, a new folder is created for each execution, labeled with the exact DateTime.
Each folder may contain more than one file. Lighter files tend to include data about the initialization stage, while heavier files usually feature the data corresponding to the actual work the bot does.


