A Ceph implementation for object storage (amazon s3 compatible)
| Name:Version | Documentation | Purpose | Alternatives | Advantages |
|---|---|---|---|---|
| Terraform 1.5.4 | Docs | Hardware Provisioner Initial Setup |
Salt Ansible |
1. Easy syntax 2. Sufficient community and documentation 3. Much better suited for hardware provisioning |
| Hetzner Provider 1.42.1 | Docs | Deploying servers | Vultr DigitalOcean |
1. Cheaper :) 2. Good community overlooking provider |
| Ansible 2.15.2 | Docs | Automating Tasks | Salt |
1. No footprint on target hosts |
| Ubuntu 22.04 | Docs | Operating system | Debian Centos |
1. Bigger community 2. Faster releases than debian 3. Bigger community than any other OS 4. Not cash grapping like centos (Yet :)) |
| Victoriametrics latest | Docs | Time-series Database | InfluxDB Prometheus |
1. High performance 2. Cost-effective 3. Scalable 4. Handles massive volumes of data 5. Good community and documentation |
| vmalert latest | Docs | Evaluating Alerting Rules | Prometheus Alertmanager |
1. Works well with VictoriaMetrics 2. Supports different datasource types |
| vmagent latest | Docs | Collecting Time-series Data | Prometheus |
1. Works well with VictoriaMetrics 2. Supports different data source types |
| Alertmanager latest | Docs | Handling Alerts | ElastAlert Grafana Alerts |
1. Handles alerts from multiple client applications 2. Deduplicates, groups, and routes alerts 3. Can be plugged to multiple endpoints (Slack, Email, Telegram, Squadcast, ...) |
| Grafana latest | Docs | Monitoring and Observability | Prometheus Datadog New Relic |
1. Create, explore, and share dashboards with ease 2.Huge community and documentation 3. Easy to setup and manage 4. Many out of the box solutions for visualization |
| Nodeexporter latest | Docs | Hardware and OS Metrics | cAdvisor Collectd |
1. Measure various machine resources 2. Pluggable metric collectors 3. Basic standard for node monitoing |
| Cephexporter latest | Docs | Monitoring Ceph Clusters | NoN I Know of |
1. Works well with Ceph 2. Exposes Ceph metrics to Prometheus |
| Docker latest | Docs | Application Deployment and Management | containerd podman |
1. Much more bells and wistels are included out of the box comparing to alternatives 2. Awsome community and documentation 3. Easy to work with |
Note Each ansible role has a general and a specific Readme file. It is encouraged to read them before firing off
p.s: Start with the readme file of main setup playbook
- Create an Api on hetzner
- Create a server as terraform and ansible provisioner (Needless to say that ansible and terraform must be installed)
- Clone the project
- In modular_terraform folder create a terraform.tfvars
- The file must contain the following variables
- hcloud_token "APIKEY"
- image_name = "ubuntu-22.04"
- server_type = "cpx31"
- location = "hel1"
- The file must contain the following variables
- Run terraform init to create the required lock file
- Before firing off, run terraform plan to see if everything is alright
- Run terraform apply
- Go Drink a cup of coffe and come back in 10 minutes or so (Hopefully everything must be up and running by then (: )
- RGW IPs are not set on the domain automatically
- No custom dashboards
- No automation for scaling or maintenance
- No audit logging (to see when,who made what changes on the cluster)
- Terraform is limited to Hetzner
- Since there is no specific range for servers, public-network of mon, in on 0.0.0.0/0
- Firewall policies minimize the risk
- Grafana datasource must be set manually http://IP_ADDRESS_:8428
- Run the following command for terraform to install dependencies and create the lock file
terraform init- Run the following command and check if there are any problems with terraform
terraform plan- Apply terraform modules and get started
terraform apply- Check the storage capacity on OSDs
ceph -s
ceph orch host ls
ceph df- Check if Mons are in quorum
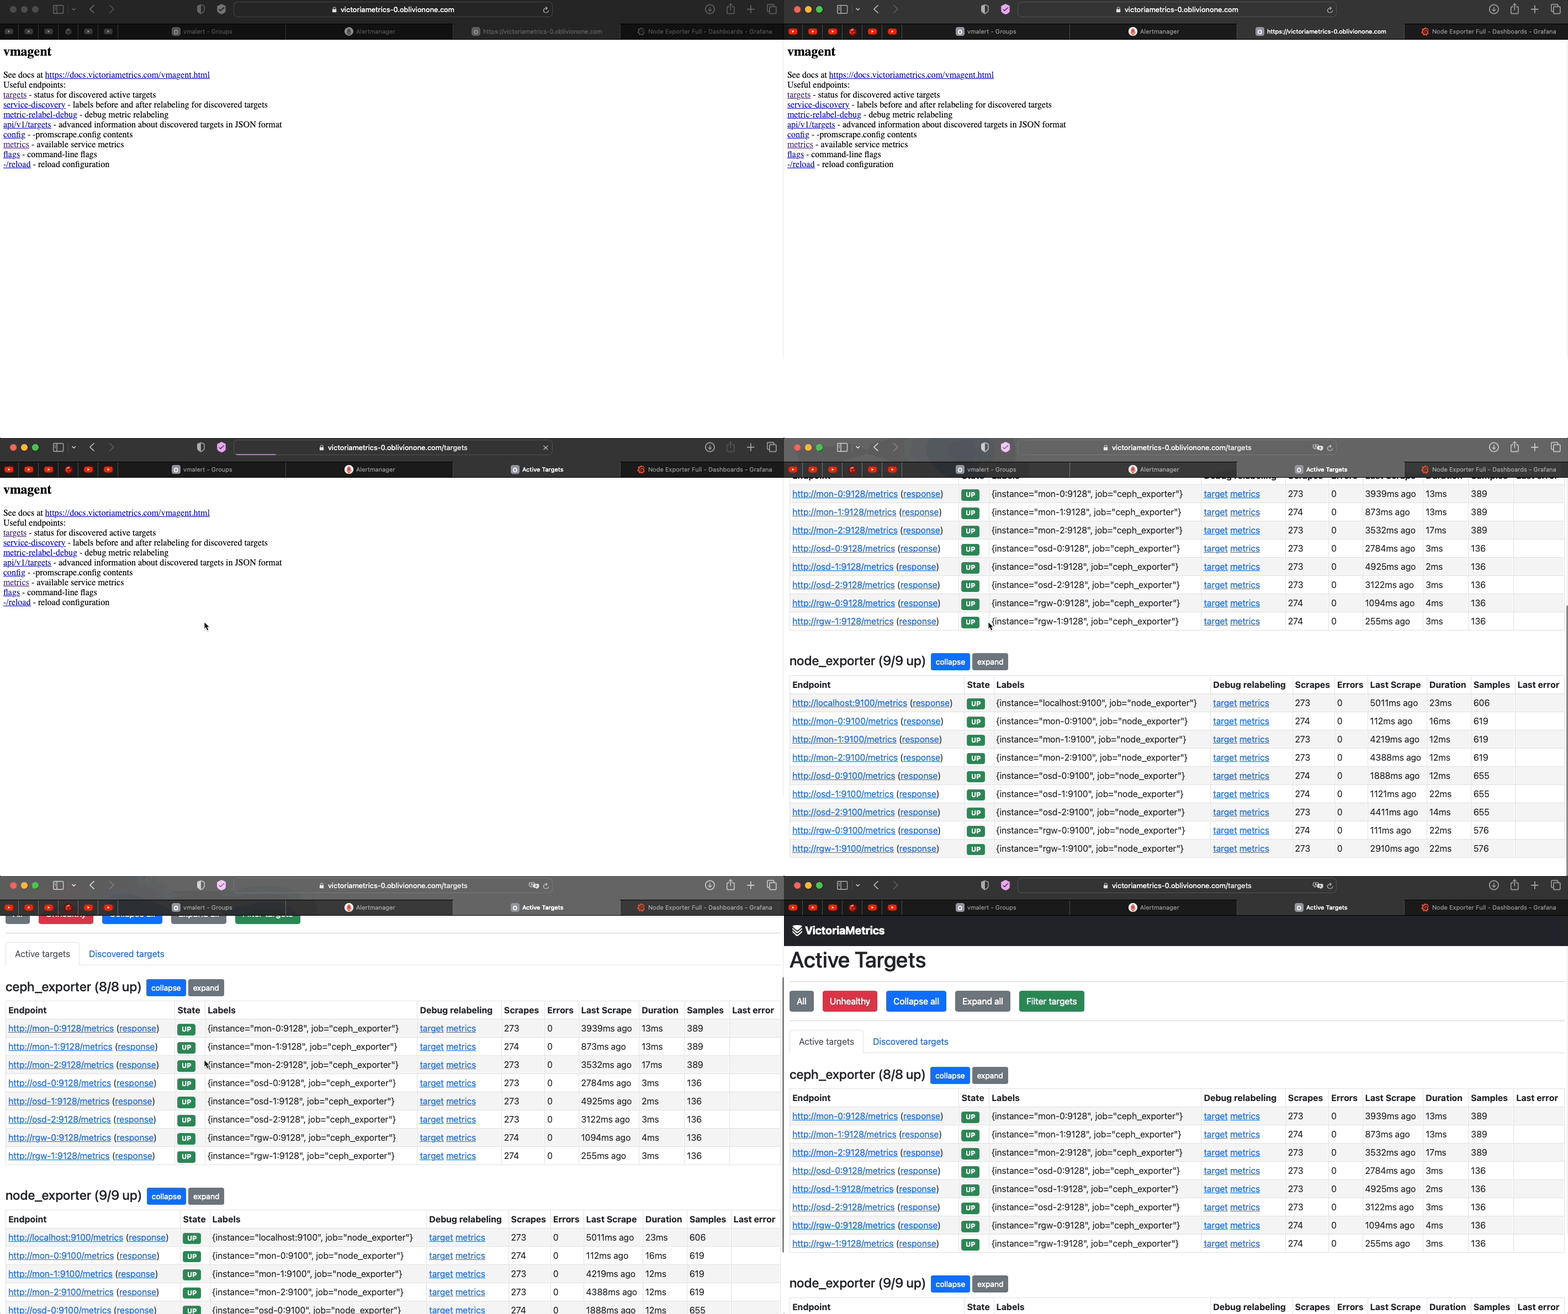
ceph mon stat- Check if Victoria_Metrics and Vmagent work
-
Note
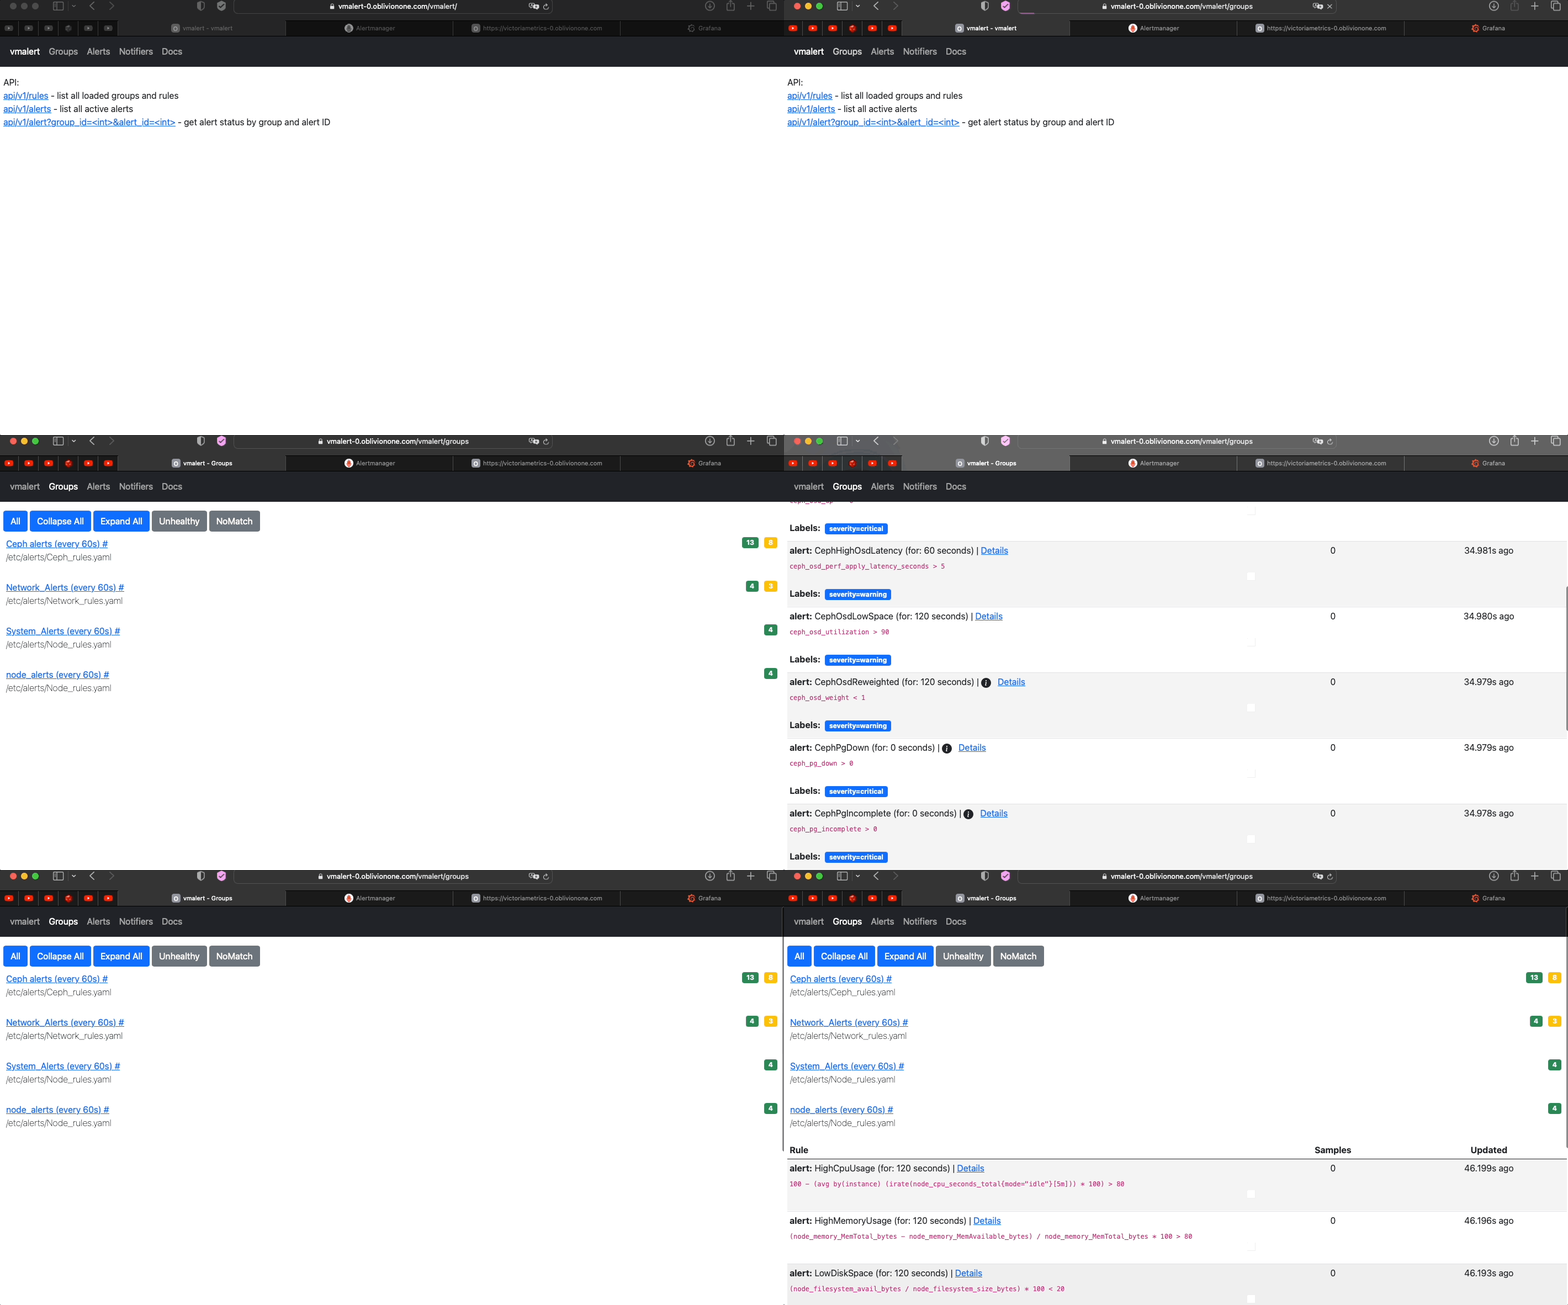
- Check if vmalert works
-
Note
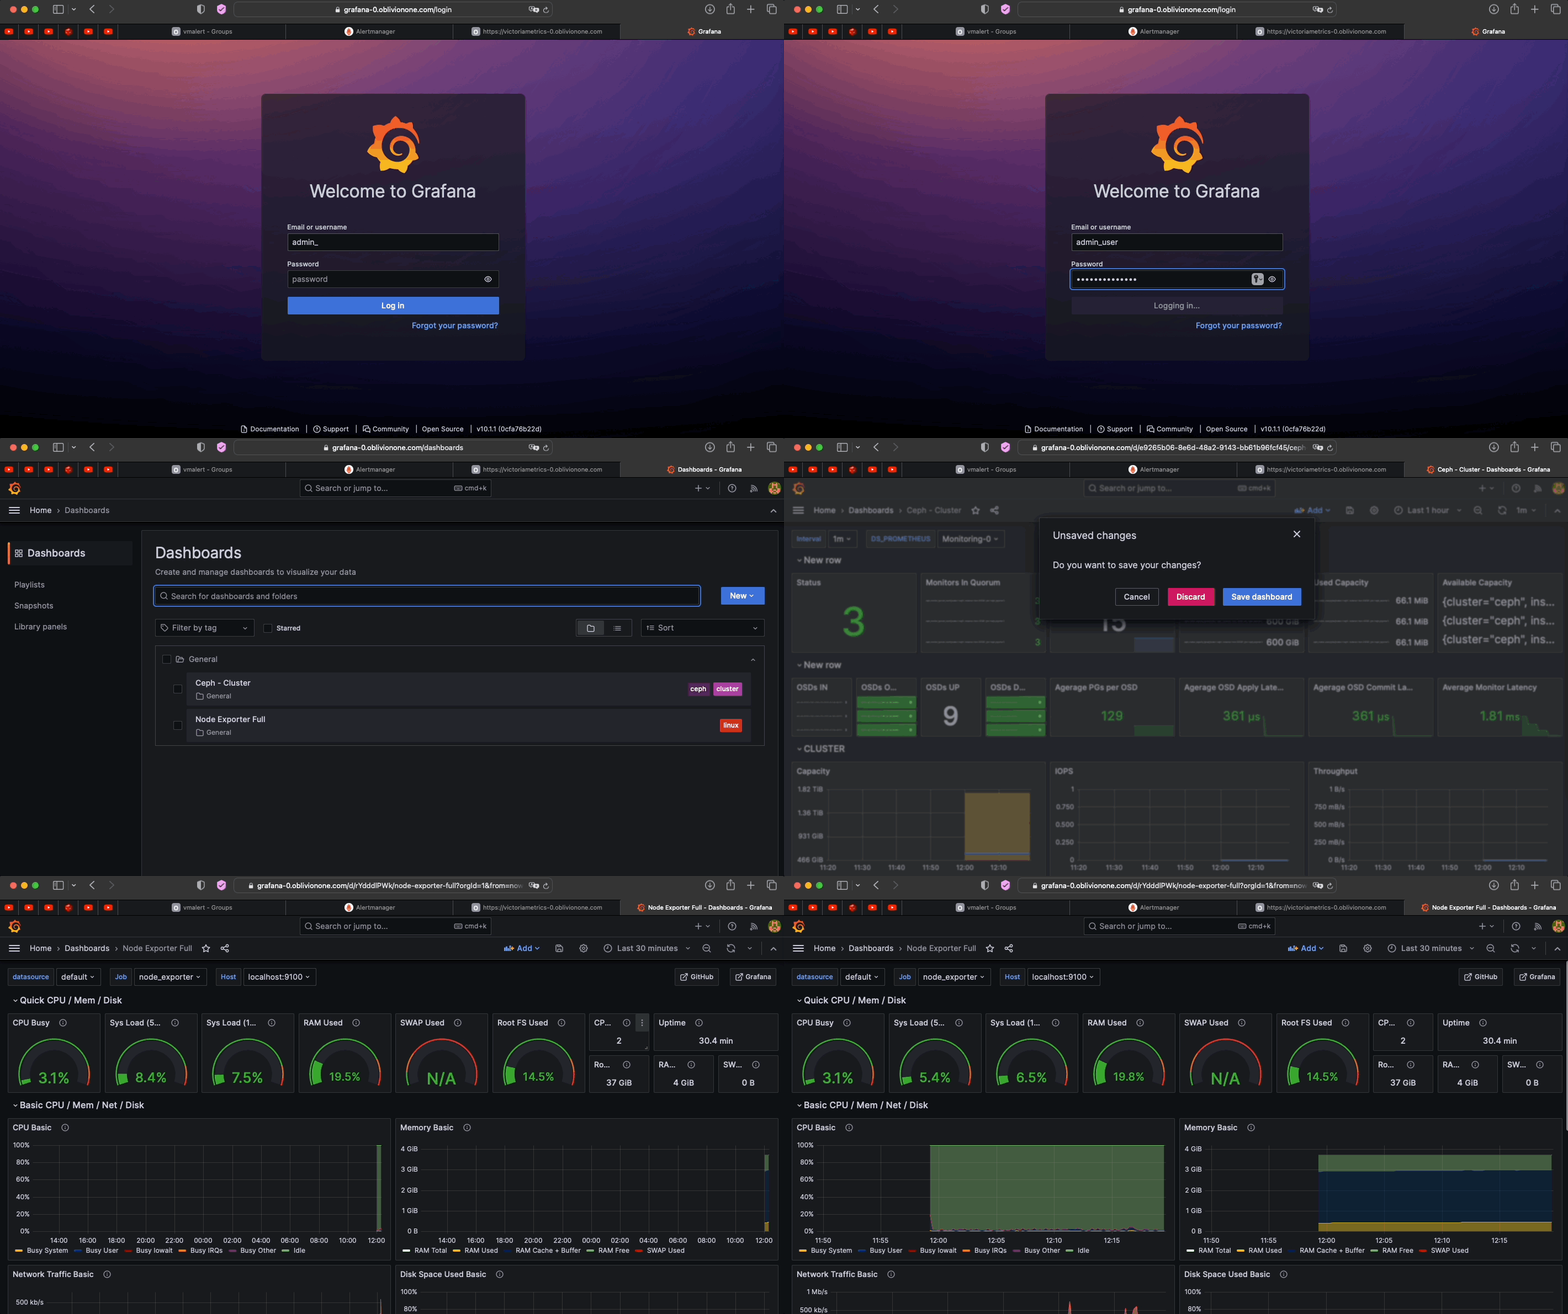
- Check if Grafana works
-
Note
All dashboard are provisioned To add custom dashbaord on load, add it to /Ansible/roles/Victoria_Metrics/files/Grafana/provisioning/dashboards as a .json file. It would automatically be loaded to Grafana Just keep in mind that you have to also copy the dashbaord using ansible to the remote destination
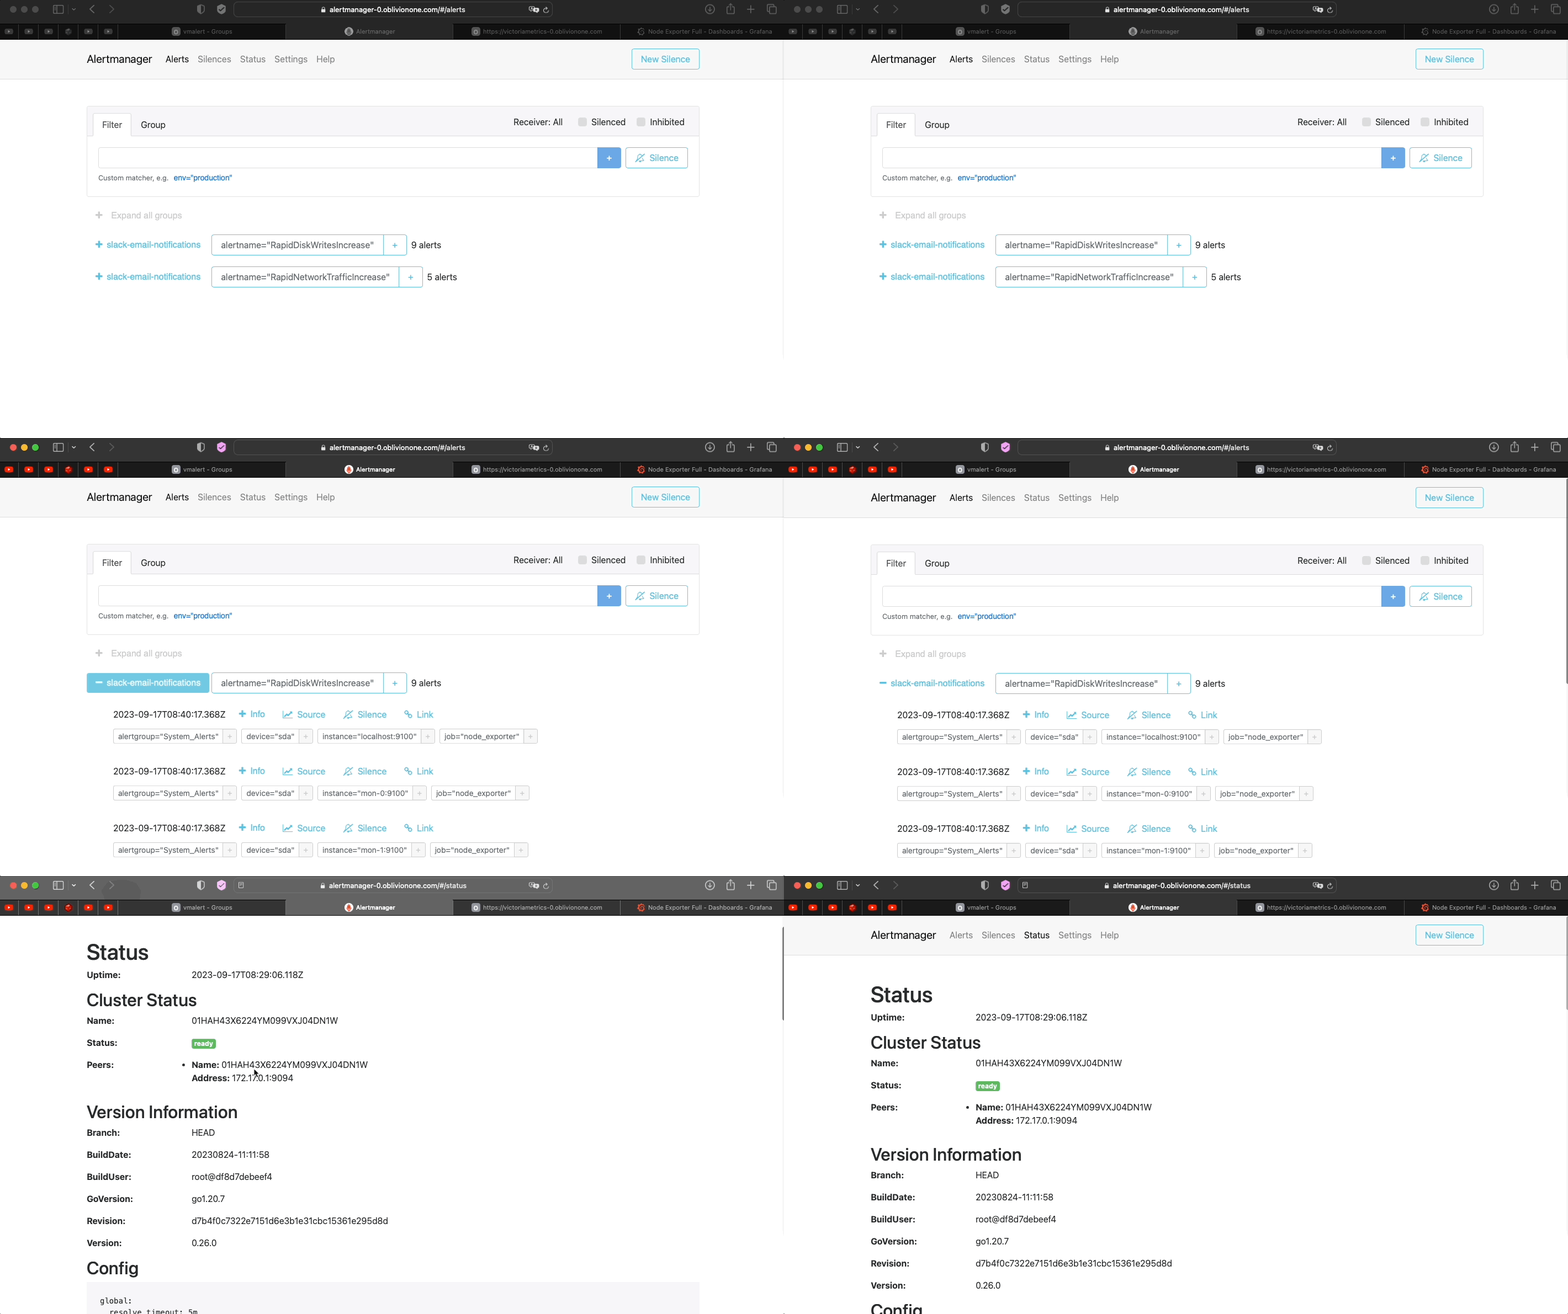
- Check if Alert manager is working
-
Note
Created some alerts to demonstrate The alerts are being routed to Slack/Gmail
- Creating a bucket
s3cmd --config=s3cfg mb s3://bucket- Upload objects
s3cmd --config=scfg put 1G.bin s3://bucket- To Clean up everything (including the nodes themselvs)
terraform destroy