Name
AlphaTrend-Strategy
Author
张超
Strategy Description
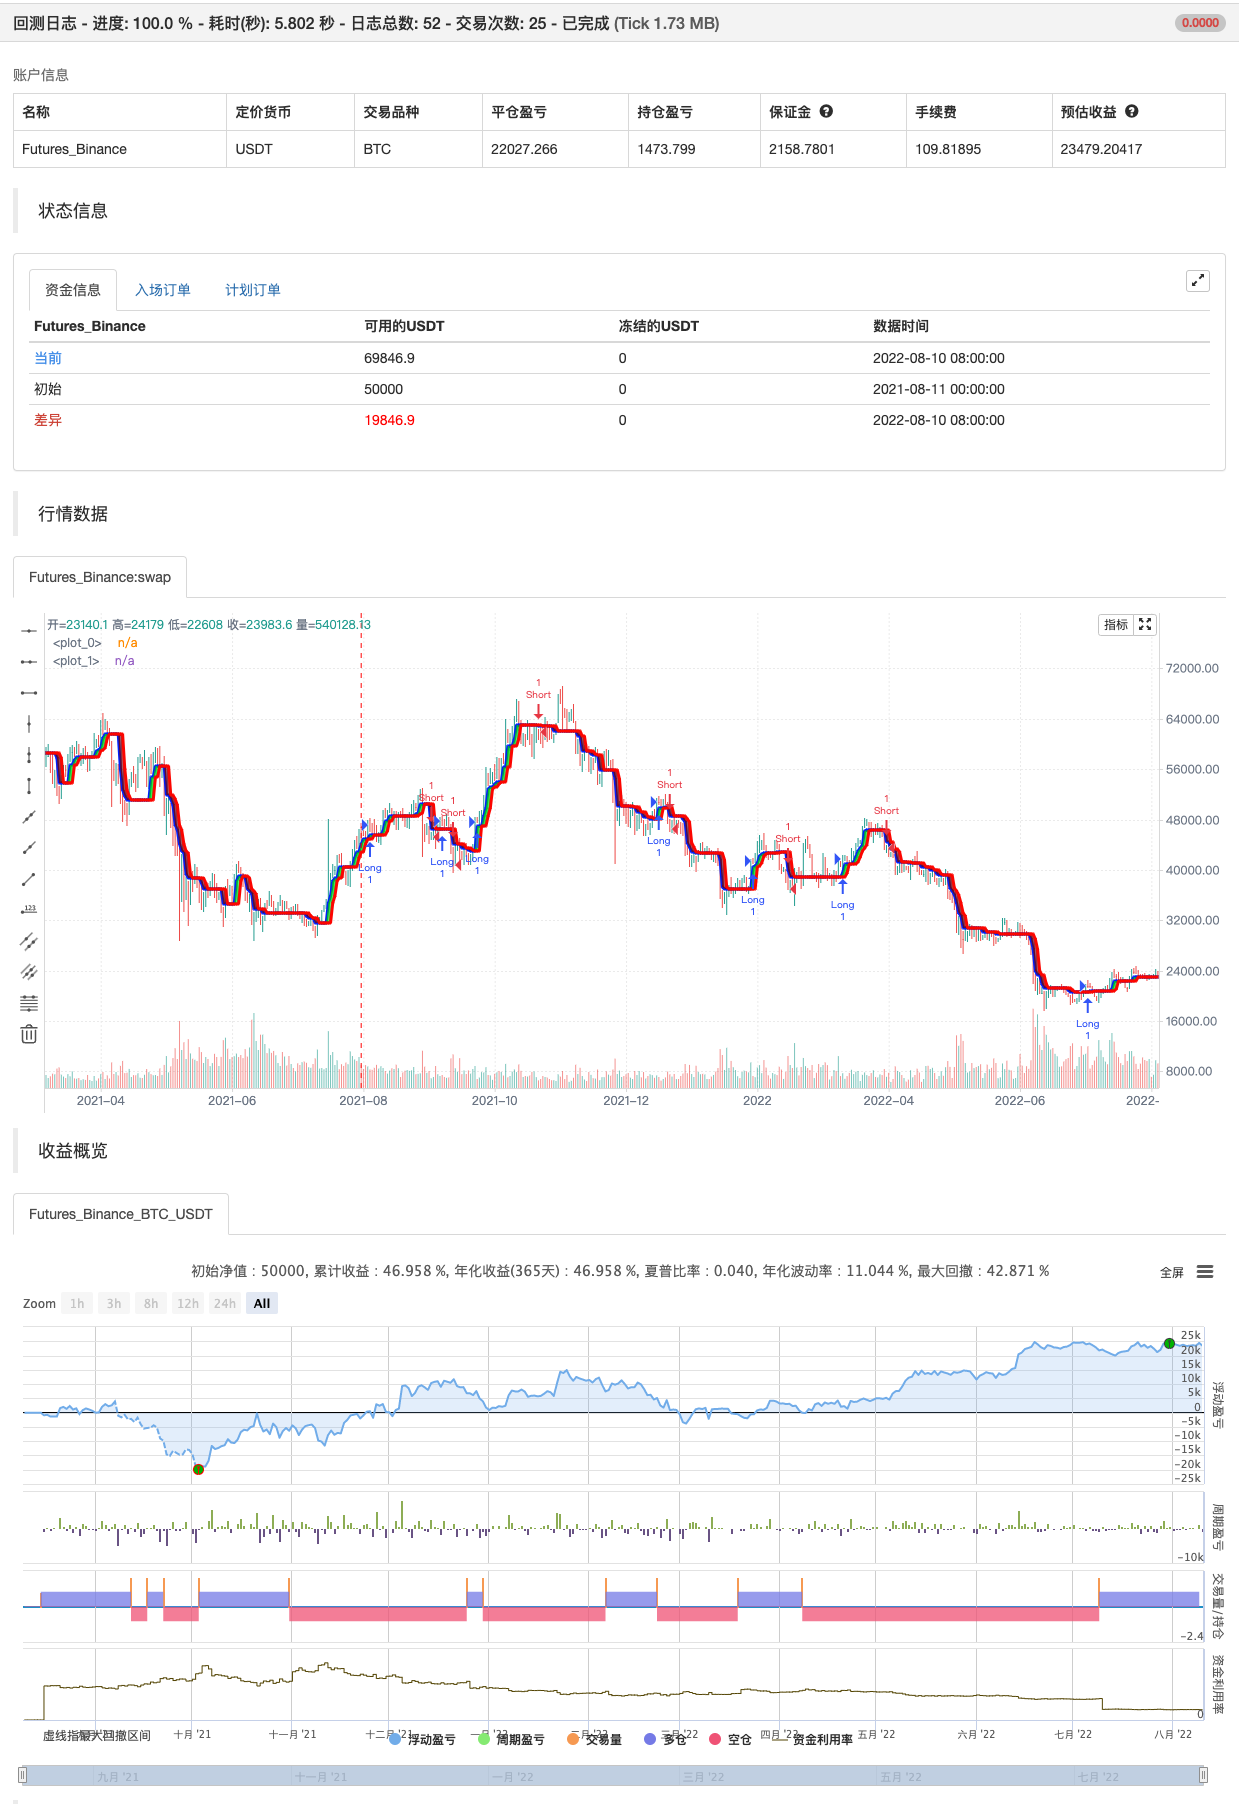
The strategy version of AlphaTrend indicator for backtesting and optimisation purposes for TradingView users:
Screener / Explorer version and an English explantion video will be published soon...
AlphaTrend's parameters are designed for daily and 4H charts, feel free to optimize on all time frames.
Hope you all use Alphatrend in your profitable trades.
Kıvanç
backtest
Strategy Arguments
| Argument | Default | Description |
|---|---|---|
| v_input_float_1 | true | Multiplier |
| v_input_1 | 14 | Common Period |
| v_input_2_close | 0 | src: close |
| v_input_3 | false | Show Signals? |
| v_input_4 | false | Change calculation (no volume data)? |
Source (PineScript)
/*backtest
start: 2021-08-11 00:00:00
end: 2022-08-10 23:59:00
period: 1d
basePeriod: 1h
exchanges: [{"eid":"Futures_Binance","currency":"BTC_USDT"}]
*/

// This source code is subject to the terms of the Mozilla Public License 2.0 at https://mozilla.org/MPL/2.0/
// author © KivancOzbilgic
// developer © KivancOzbilgic
//@version=5

strategy("AlphaTrend Strategy", shorttitle='ATst', overlay=true, format=format.price, precision=2, margin_long=100, margin_short=100)
coeff = input.float(1, 'Multiplier', step=0.1)
AP = input(14, 'Common Period')
ATR = ta.sma(ta.tr, AP)
src = input(close)
showsignalsk = input(title='Show Signals?', defval=false)
novolumedata = input(title='Change calculation (no volume data)?', defval=false)
upT = low - ATR * coeff
downT = high + ATR * coeff
AlphaTrend = 0.0
AlphaTrend := (novolumedata ? ta.rsi(src, AP) >= 50 : ta.mfi(hlc3, AP) >= 50) ? upT < nz(AlphaTrend[1]) ? nz(AlphaTrend[1]) : upT : downT > nz(AlphaTrend[1]) ? nz(AlphaTrend[1]) : downT

color1 = AlphaTrend > AlphaTrend[2] ? #00E60F : AlphaTrend < AlphaTrend[2] ? #80000B : AlphaTrend[1] > AlphaTrend[3] ? #00E60F : #80000B
k1 = plot(AlphaTrend, color=color.new(#0022FC, 0), linewidth=3)
k2 = plot(AlphaTrend[2], color=color.new(#FC0400, 0), linewidth=3)

fill(k1, k2, color=color1)

buySignalk = ta.crossover(AlphaTrend, AlphaTrend[2])
sellSignalk = ta.crossunder(AlphaTrend, AlphaTrend[2])


K1 = ta.barssince(buySignalk)
K2 = ta.barssince(sellSignalk)
O1 = ta.barssince(buySignalk[1])
O2 = ta.barssince(sellSignalk[1])

plotshape(buySignalk and showsignalsk and O1 > K2 ? AlphaTrend[2] * 0.9999 : na, title='BUY', text='BUY', location=location.absolute, style=shape.labelup, size=size.tiny, color=color.new(#0022FC, 0), textcolor=color.new(color.white, 0))

plotshape(sellSignalk and showsignalsk and O2 > K1 ? AlphaTrend[2] * 1.0001 : na, title='SELL', text='SELL', location=location.absolute, style=shape.labeldown, size=size.tiny, color=color.new(color.maroon, 0), textcolor=color.new(color.white, 0))


longCondition = buySignalk
if (longCondition)
    strategy.entry("Long", strategy.long)

shortCondition = sellSignalk
if (shortCondition)
    strategy.entry("Short", strategy.short)
Detail
https://www.fmz.com/strategy/377541
Last Modified
2022-08-12 16:51:26

