-
Notifications
You must be signed in to change notification settings - Fork 10
Introduction
Asami is a graph database, which may be a new approach to data management for some users. This page tries to explain what graph data is and how to use Asami to interact with it.
When we refer to a "Graph Database" we are not referring to the sort of graph that we often see in magazines, or are generated from spreadsheets. Instead, the "graph" being referenced here is a branch of mathematics called "Graph Theory". These graphs describe a set of items called "Nodes", which are connected with lines that are called "Edges".
An example of this might be a graph of social connections between people. The people in such a network can be represented by the "nodes" of a graph, and the "edges" can represent the social connections between them.

Each node appears once in a graph, regardless of how many connections it may have, and any pair of nodes will only have a single edge between them. Another important thing is that an image of a graph is merely a representation of the data. The location of the nodes and the edges do not matter. Also, edges do not interact in any way, so even if the lines indicating edges cross over each other, this does not mean anything. For instance, the following 2 graphs represent identical data to the above graph:

While many subtleties emerge from this structure, these simple ideas describe the entire foundation of this branch of mathematics!
However, most graph databases (including Asami) add two important features to the above definition: directed edges, and labeling.
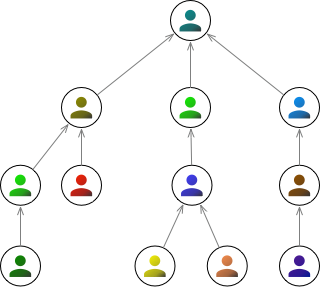
A variation on the above graphs is when the edges are given a direction. We can represent this in an image using arrows instead of simple lines. Perhaps this might be used to represent a company hierarchy.

Importantly, having direction on edges means that there can now exist 2 edges between a pair of nodes: one in either direction.
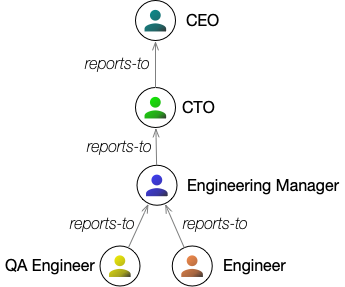
A labeled graph will have labels on both the nodes and the edges. This provides a lot of new possibilities:
- Nodes need not represent the same types of things. They can represent anything: people, organizations, inventory items, account entries – anything at all.
- Multiple edges can connect the same nodes. For instance, a woman who is a mother to someone is also that person's parent. Both of these connections can be represented as distinct labeled edges.
Labeling some of the previous graph, we could get something like this:

Labeled, directed graphs form the basic structure of graph databases.
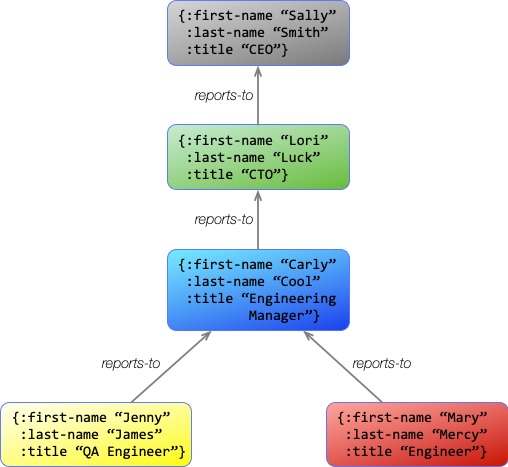
Different graph databases make different choices about how they store their graph information. A common approach is for each node in the graph to be an object that has multiple attributes on it. We see this sort of thing in the Neo4J Graph Database.
Using this approach, let's add some details to the organization chart we had a moment ago.

This diagram shows how entities can group a lot of information together in the graph. However, Asami and other graph databases actually break this information down into basic graph structure. The information is identical, but it just gets managed a little differently.