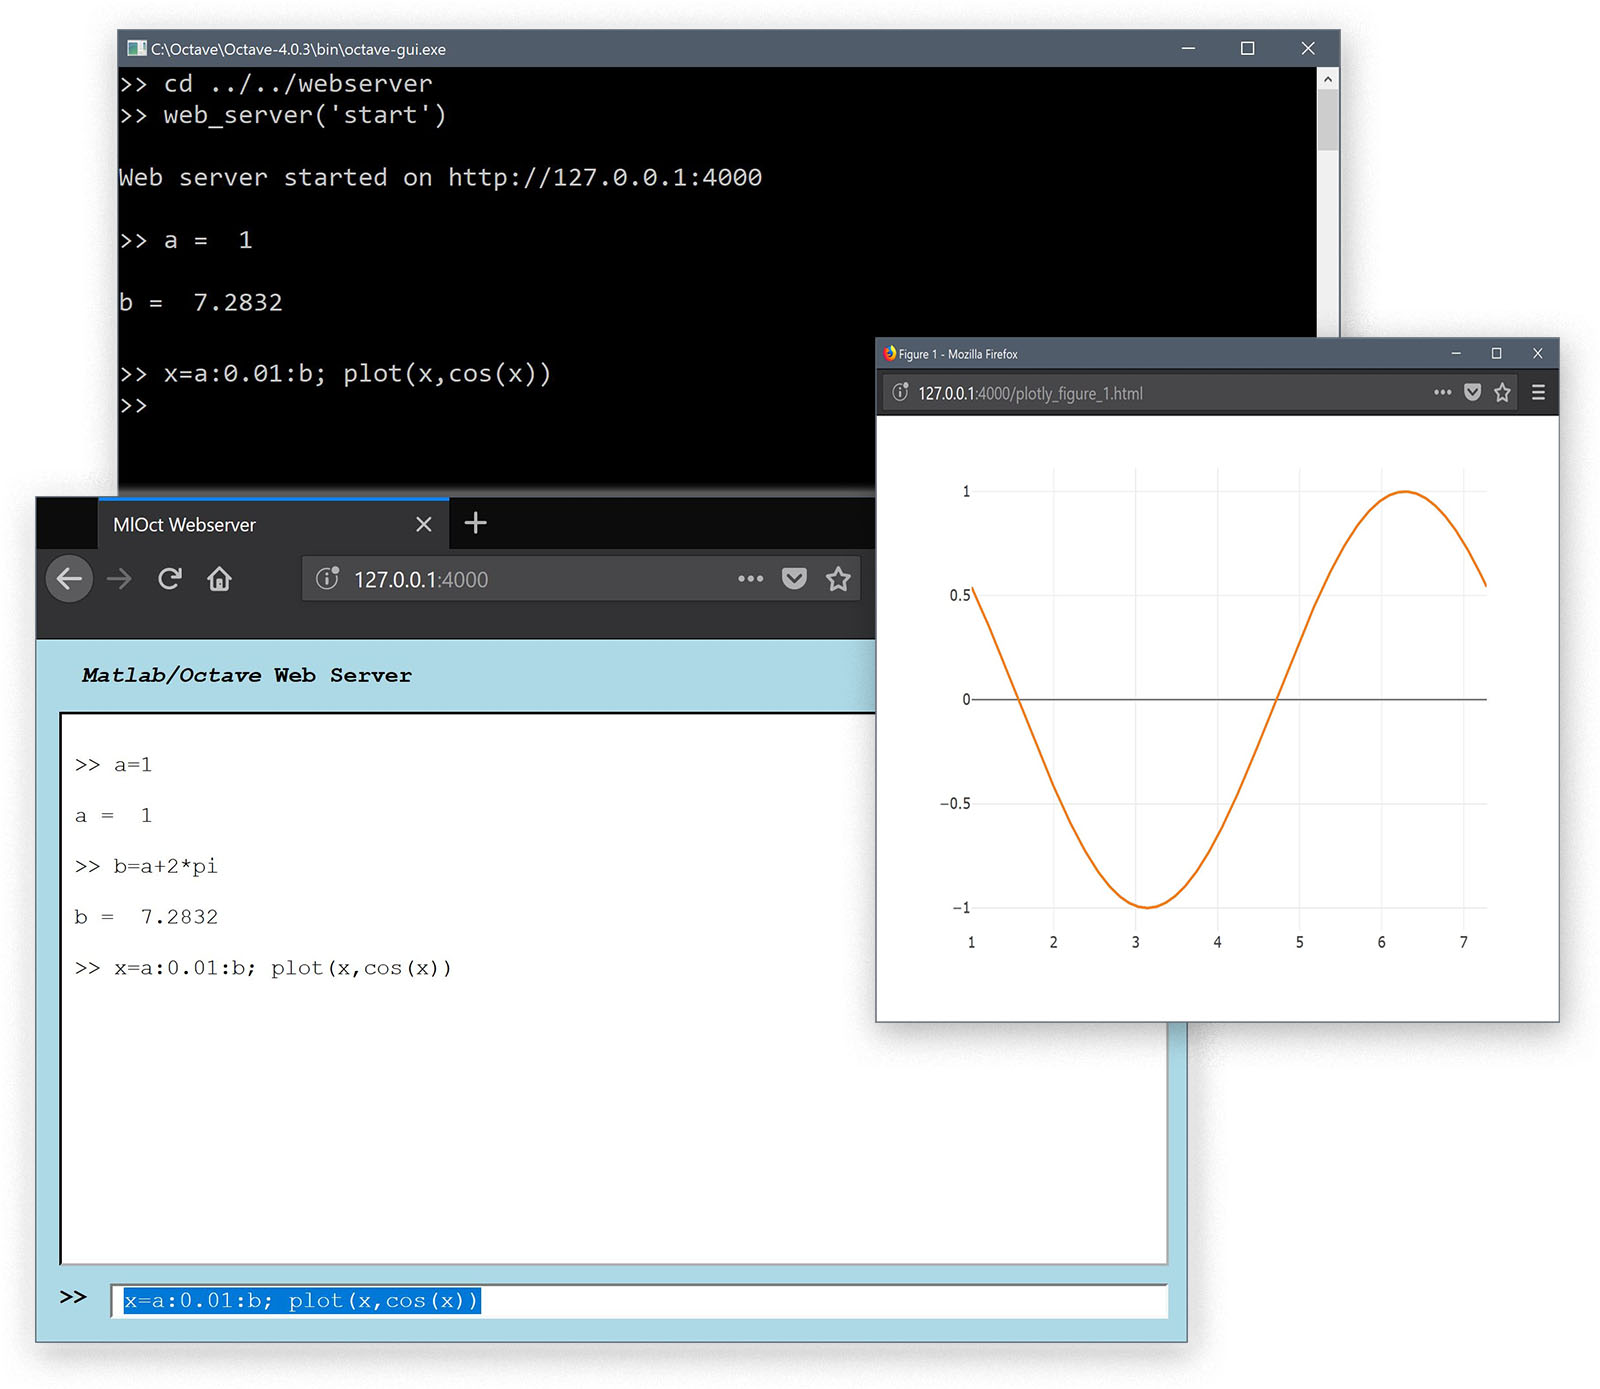
A simple experimental web browser interface for Matlab and Octave.
Running the web_server('start') command starts a local
TCP and web server and opens a connected web browser window which
accepts Matlab and Octave commands as input. Plots are translated via
the Plotly Javascript library into Html graphs.
Download the webserver archive and extract the contents in a convenient folder.
-
A modern web browser with Javascript enabled and flexbox CSS support.
-
Java installed and support enabled with Matlab and Octave.
Simply change to the extracted folder or add it to the Matlab/Octave paths and run the command
web_server( 'start' )
to start the web server and open the mirrored Matlab/Octave session in the default web browser. To stop the sever run the command
web_server( 'stop' )
To see the available options enter
help web_server
help tcp_server
- The Plotly library needs further improvements to fully support Octave (currently only line plots are supported). The main issue is that a lot of struct calls in the Plotly conversion function are accessed as s.Color or s.XLabel where in Octave the fields are all in lower case, that is s.color and s.xlabel.
