An open-source dev tool that provides an intuitive way to view the health, structure, and live metrics of your Kubernetes cluster
- What is KubeScrape?
- Installation and Prerequisites
- Features
- Future Enhancements
- Engineering Team
- License
KubeScape is an open-source monitoring tool designed and developed to help Kubernetes users track the health, view live metrics, and view structure of the Kubernetes cluster. The application currently has 5 easy to navigate and intutive pages (see features section for an overview of each page).
Installing our app is just a few clicks away! Vist our github releases page to download KubeScrape's desktop application. Please be sure to select the required executable that is compatiable with your operating system. Note: You may need to configure privacy or security settings to allow the application to open without being verified.
- (Required) The following must be deployed in your kubernetes cluster for KubeScrape to gather metrics and information from:
- Prometheus
- Node Exporter
- Kube-state-metrics
- (Required) If you have your own instance of prometheus installed, please expose it to
port 30000as KubeScrape currently makes API calls to this port. As an enhancement, we are looking to allow users to input the port which you are running Prometheus on. - (Optional) KubeScrape's alerts tab will only showcase alert details if Prometheus alert rules are configured. However, the application will still display other details regarding your kubernetes cluster even if alert rules are not implemented.
If you do not have the above requirements set up please go to the following repo which includes sample manifest files for Prometheus (including alert rules), node exporter, and kube-state-metrics. Follow the 4-step process in the ReadMe to deploy Prometheus with ease.
Supplementary Repo: KubeScrape_PrometheusManifests
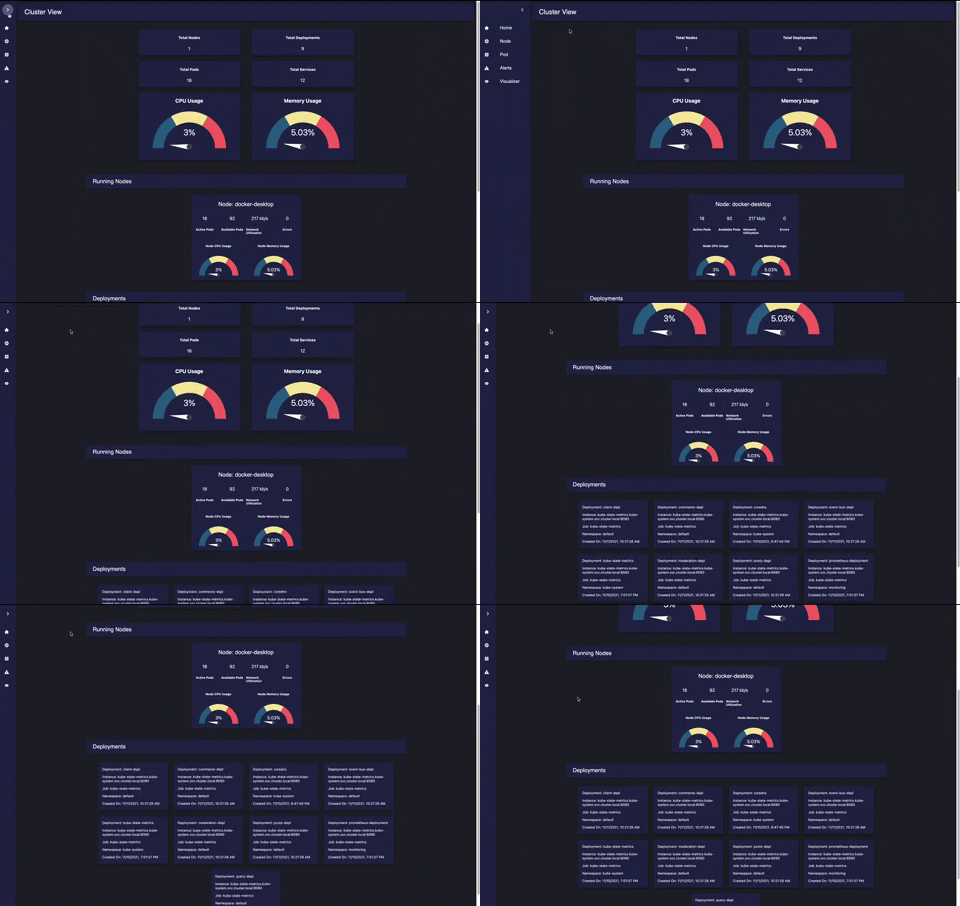
The Cluster View, or Home Page, presents an overview of the cluster's health and important cluster metrics/information. Hover and click on a node to automatically route to the Node Details page for more information regarding running pods.
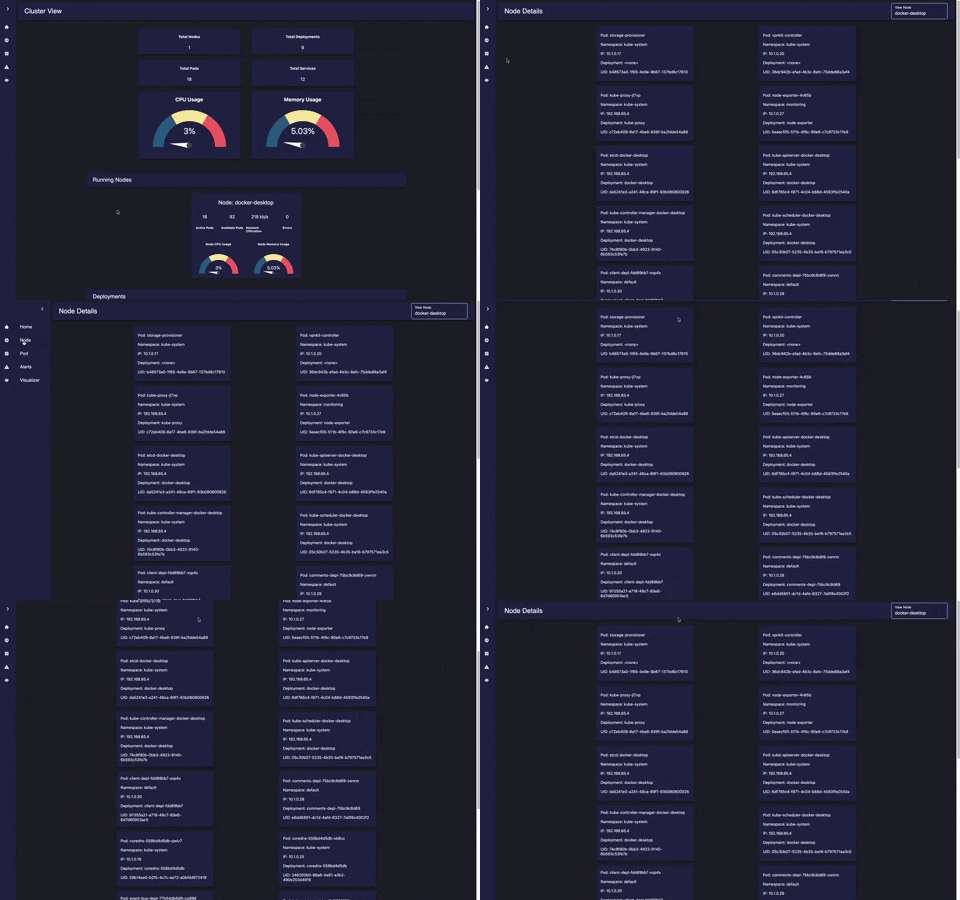
The Node Details page displays basic information about running pods within the selected node. Hover and click on a pod to route to the Pod Details for pod metrics.
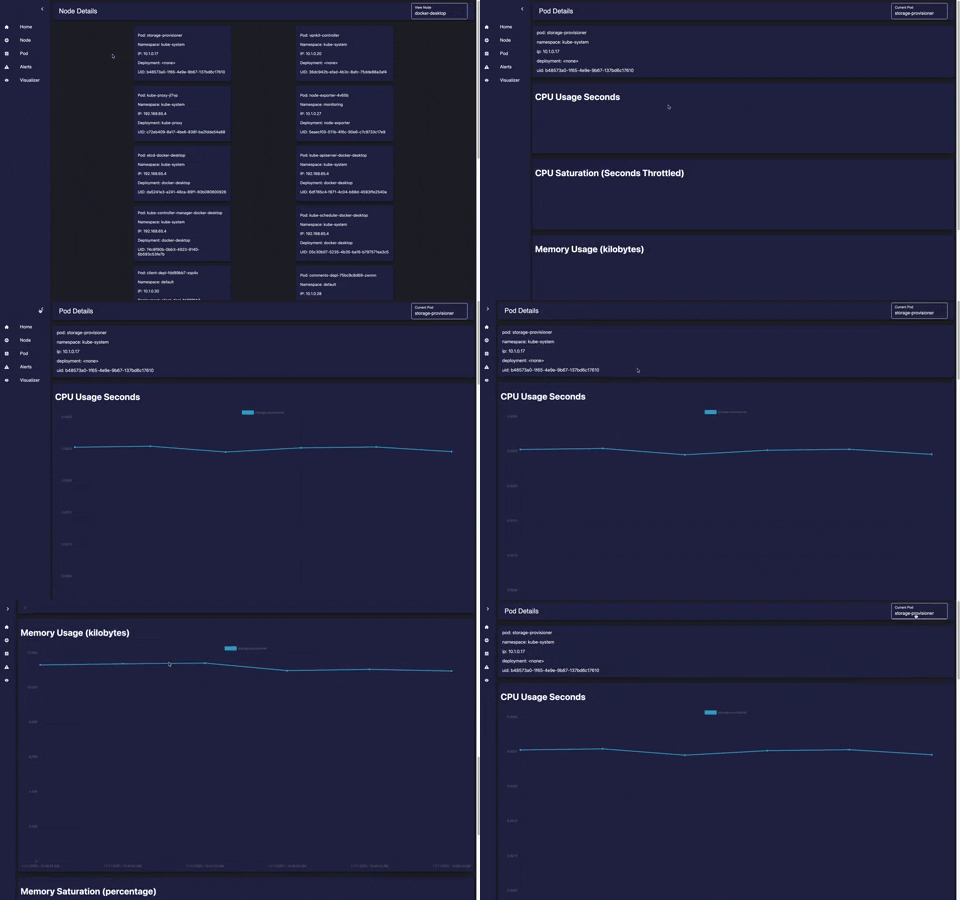
The Pod Details page graphically displays CPU Usage, CPU Saturation, Memory Usage, and Memory Saturation for each container of the selected pod. Click the drop down menu on the top right to switch between pods.
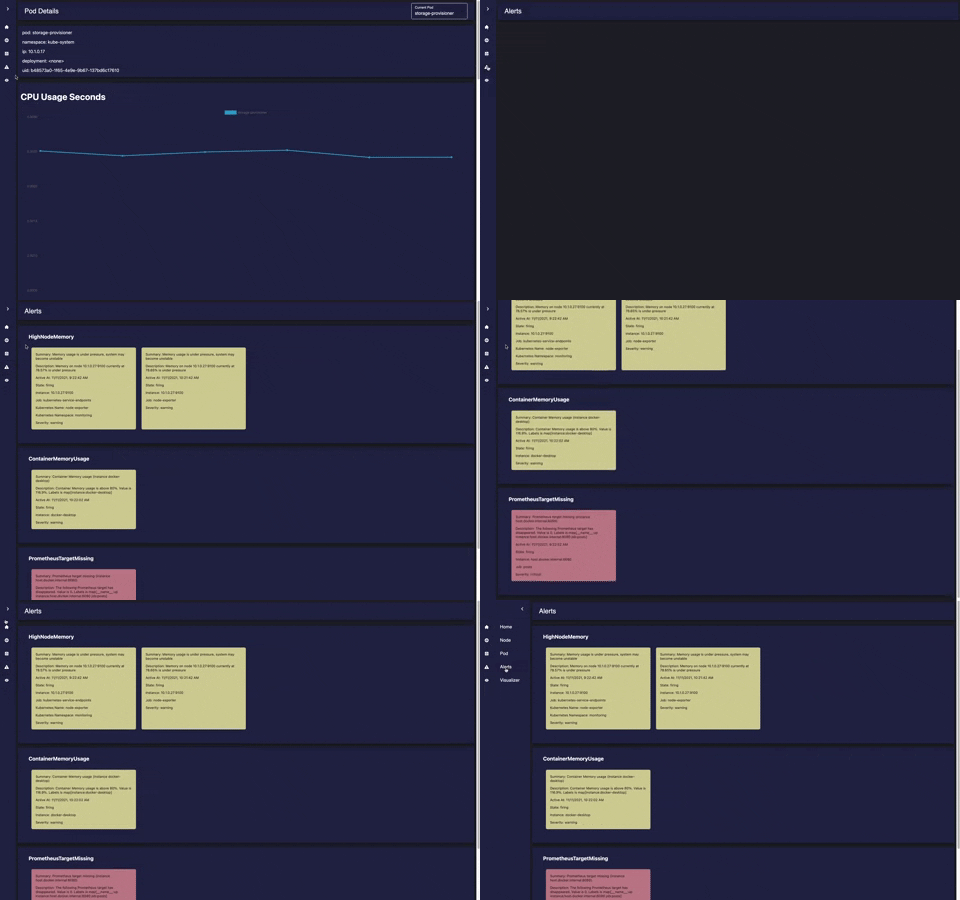
The Alerts page displays alerts tracked by Prometheus that are in "firing state". The alert components are grouped by alert name and changes color depending on the set severity level.
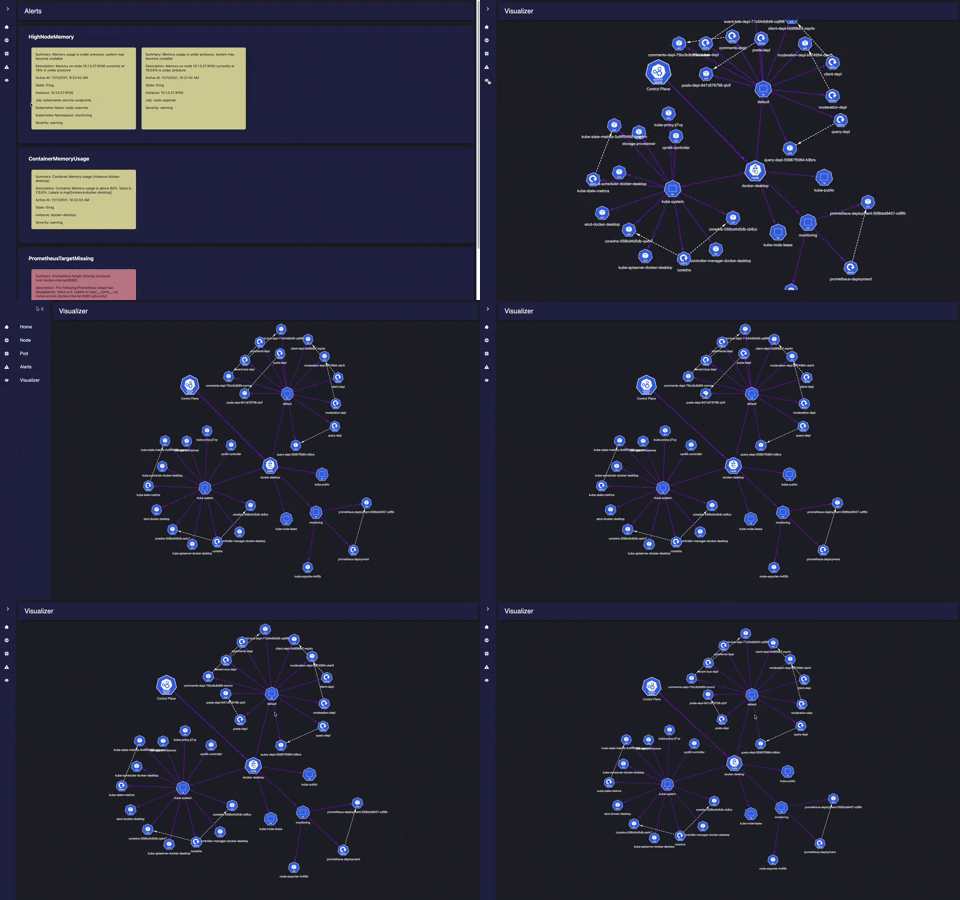
The Visualizer presents a relational diagram of your kubernetes cluster objects, organized by namespace.
- Implementing additional metrics and visualizations for nodes, pods, and containers (suggestions welcomed)
- Integrate an error logs to allow for more comprehensive cluster debugging
- Support start, stop, and remove objects
- Ability to filter pods and deployments by namespace
We welcome any feedback, contributions, or suggestions to improve KubeScrape to help monitor your cluster better. So please feel free to fork, clone this repo, and
leave a 
Anne Chan | Jackie Whitworth | Jacob Davis | Vince Nguyen
Released under the MIT License


