-
Notifications
You must be signed in to change notification settings - Fork 0
/
Copy pathlesson_1.Rmd
339 lines (294 loc) · 9.81 KB
/
lesson_1.Rmd
1
2
3
4
5
6
7
8
9
10
11
12
13
14
15
16
17
18
19
20
21
22
23
24
25
26
27
28
29
30
31
32
33
34
35
36
37
38
39
40
41
42
43
44
45
46
47
48
49
50
51
52
53
54
55
56
57
58
59
60
61
62
63
64
65
66
67
68
69
70
71
72
73
74
75
76
77
78
79
80
81
82
83
84
85
86
87
88
89
90
91
92
93
94
95
96
97
98
99
100
101
102
103
104
105
106
107
108
109
110
111
112
113
114
115
116
117
118
119
120
121
122
123
124
125
126
127
128
129
130
131
132
133
134
135
136
137
138
139
140
141
142
143
144
145
146
147
148
149
150
151
152
153
154
155
156
157
158
159
160
161
162
163
164
165
166
167
168
169
170
171
172
173
174
175
176
177
178
179
180
181
182
183
184
185
186
187
188
189
190
191
192
193
194
195
196
197
198
199
200
201
202
203
204
205
206
207
208
209
210
211
212
213
214
215
216
217
218
219
220
221
222
223
224
225
226
227
228
229
230
231
232
233
234
235
236
237
238
239
240
241
242
243
244
245
246
247
248
249
250
251
252
253
254
255
256
257
258
259
260
261
262
263
264
265
266
267
268
269
270
271
272
273
274
275
276
277
278
279
280
281
282
283
284
285
286
287
288
289
290
291
292
293
294
295
296
297
298
299
300
301
302
303
304
305
306
307
308
309
310
311
312
313
314
315
316
317
318
319
320
321
322
323
324
325
326
327
328
329
330
331
332
333
334
335
336
337
338
339
---
title: "Introduction"
subtitle: "Lesson 1"
author: "Gilad Ravid"
institute: "BGU"
date: "16/8/2021 (updated: `r Sys.Date()`)"
output:
xaringan::moon_reader:
lib_dir: libs
css: ["default", "gilad.css"]
nature:
highlightStyle: github
highlightLines: true
countIncrementalSlides: false
beforeInit: "macros.js"
---
.scroll-output[
```{r echo=FALSE, warning=FALSE}
library(linguisticsdown)
library(ggplot2)
library(knitr)
library(dplyr)
library(readxl)
library(httr)
library(tidyverse)
library(lubridate)
library(ggmap)
library(ggrepel)
library(gridExtra)
library(pander)
library(RCurl)
source("common.r")
```
]
---
### Lesson Goals
- Why to use visualization
- How visualization applied to problem solving
- The process of visualization
---
### Definitions
- Visualization is the communication of information using graphical representation
- visualization noun
vi··su··al··i··za··tion | \ ˌvi-zhə-wə-lə-ˈzā-shən , ˌvi-zhə-lə-, ˌvizh-wə-lə- \
1. formation of mental visual images
2. the act or process of interpreting in visual terms or of putting into visible form
3. the process of making an internal organ or part visible by the introduction (as by swallowing) of a radiopaque substance followed by radiography
- Computer-based visualization systems provide visual representations of datasets designed to help people carry out tasks more effectively.
(https://www.merriam-webster.com/dictionary/visualization)
---
### A Picture is Worth a Thousand Words
.right[]
- Wealth of information
- Quickly processed
- Parallel processing with human perceptual system
- (can be) Independent of local language or culture
---
### Vis. is Anywhere
```{r, echo=FALSE, cache=TRUE,out.width=200}
include_graphics2("images/1_2.png")
include_graphics2("images/1_3.png")
include_graphics2("images/1_4.png")
include_graphics2("images/1_6.jpeg")
```
---
### Vis. is Anywhere (2)
```{r, echo=FALSE, cache=TRUE,out.width=200}
include_graphics2("images/1_5.png")
include_graphics2("images/1_7.png")
include_graphics2("images/1_8.png")
include_graphics2("images/1_9.jpg")
include_graphics2("images/1_10.png")
```
---
### Vis. is Anywhere (3)
```{r, echo=FALSE, out.height="450px", cache=TRUE}
include_graphics2("images/1_11.jpeg")
```
---
### Tufte Definition
Graphical excellence is the well-designed presentation of interesting data—a matter of substance, of statistics, and of design. ... [It] consists of complex ideas communicated with clarity, precision, and efficiency. ... [It] is that which gives to the viewer the greatest number of ideas in the shortest time with the least ink in the smallest space. ... [It] is nearly always multivariate. ... Graphical excellence requires telling the truth about the data. (Tufte 1983, 51)
---
### Open Questions
- Why visualizations have a richer description then textual form?
- In what kinds of situations are visualizations effective?
- What types of information can and cannot be visualized?
- How many different ways are there to show the same data?
- Which ones are best for particular circumstances?
- Why should we study visualization?
---
### Same or Different?
`r columns(2, 1)`
.scroll-output[
```{r warning=FALSE, cache=TRUE}
mydf=read.csv("datasets/corona_deceased_ver_00138.csv",header=T)
mydf$Time_between_positive_and_death=as.numeric(mydf$Time_between_positive_and_death)
mydf$Time_between_positive_and_hospitalization=as.numeric(mydf$Time_between_positive_and_hospitalization)
mydf$Length_of_hospitalization=as.numeric(mydf$Length_of_hospitalization)
mydf$gender=as.factor(mydf$gender)
mydf$Age_group=as.factor(mydf$Age_group)
plot1<-ggplot(mydf,aes(x=Time_between_positive_and_hospitalization, y=Time_between_positive_and_death,color=gender)) +
geom_point()
plot1+scale_x_continuous(limits=c(-500,10000),labels = NULL)+scale_y_continuous(limits=c(0,4000),labels = NULL)
plot1+scale_x_continuous(limits=c(-300,300),labels = NULL)+scale_y_continuous(limits=c(0,2000),labels = NULL)
plot1+scale_x_continuous(limits=c(-2000,2000),labels = NULL)+scale_y_continuous(limits=c(0,300),labels = NULL)
plot1+scale_x_continuous(limits=c(-300,300),labels = NULL)+scale_y_continuous(limits=c(0,300),labels = NULL)
plot1+scale_x_continuous(limits=c(-300,300),labels = NULL)+scale_y_continuous(limits=c(-100,300),labels = NULL,trans="log10")
```
]
---
### Same or Different? (2)
`r columns(2, 1)`
.scroll-output[
```{r warning=FALSE, cache=TRUE}
plot1<-ggplot(mydf,aes(x=Time_between_positive_and_hospitalization, y=Time_between_positive_and_death,color=gender)) +
geom_point()
plot1+scale_x_continuous(limits=c(-500,10000))+scale_y_continuous(limits=c(0,4000))
plot1+scale_x_continuous(limits=c(-300,300))+scale_y_continuous(limits=c(0,2000))
plot1+scale_x_continuous(limits=c(-2000,2000))+scale_y_continuous(limits=c(0,300))
plot1+scale_x_continuous(limits=c(-300,300))+scale_y_continuous(limits=c(0,300))
plot1+scale_x_continuous(limits=c(-300,300))+scale_y_continuous(limits=c(-100,300),trans="log10")
```
]
---
### Influence of Data Display Format

.small[
From: Elting, L. S., Martin, C. G., Cantor, S. B., Rubenstei, E. B. (1999) Influence of data display formats on physician investigators' decisions to stop clinical trials: prospective trial with repeated measures. BMJ, 318( 7197), 1527-1531
]
---
### Organizational Chart

.small[
From: https://www.kfar-saba.muni.il/uploads/n/1628075616.3487.pdf
]
---
### History of Vis.
https://www.datavis.ca/milestones
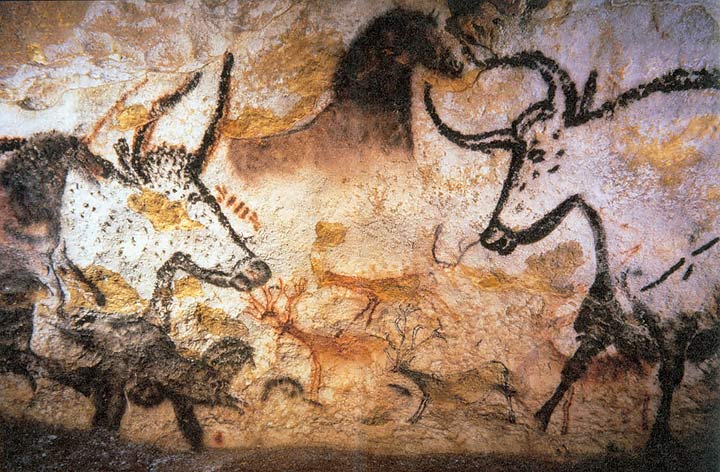
.small[
Lascaux cave ~17,000 year ago
]
---
### Kish Table

.small[
Kish Table, 3200 BC
]
---
### Hieroglyphics

.small[
Hieroglyphs on the temple at ancient Ombos, near modern Kawm Umbu, Egypt.
]
- logograms
- phonograms
- determinatives
---
### Tabula Peutingeriana

.small[
Tabula Peutingeriana ~1300 AC
]
---
### Hereford Mappa Mundi

.small[
~1300 AC
]
---
### John Snow's Map

.small[
1854
]
---
### Valentine Seaman's Map of Yellow Fever Epidemic in New York City

.small[1798]
---
### Abu Rayhan Muhammad Ibn Ahmad al-Biruni

.small[Kitab al-Qanun al-Mas’udi ~1030]
---
### Somnium Scripionus (Cicero)

.small[~10-11 cnetrury AC]
---
### Charles Joseph Minard

"Probably the best statistical graphic ever drawn" (Edward Tufte)
.small[1869]
---
### William Playfair
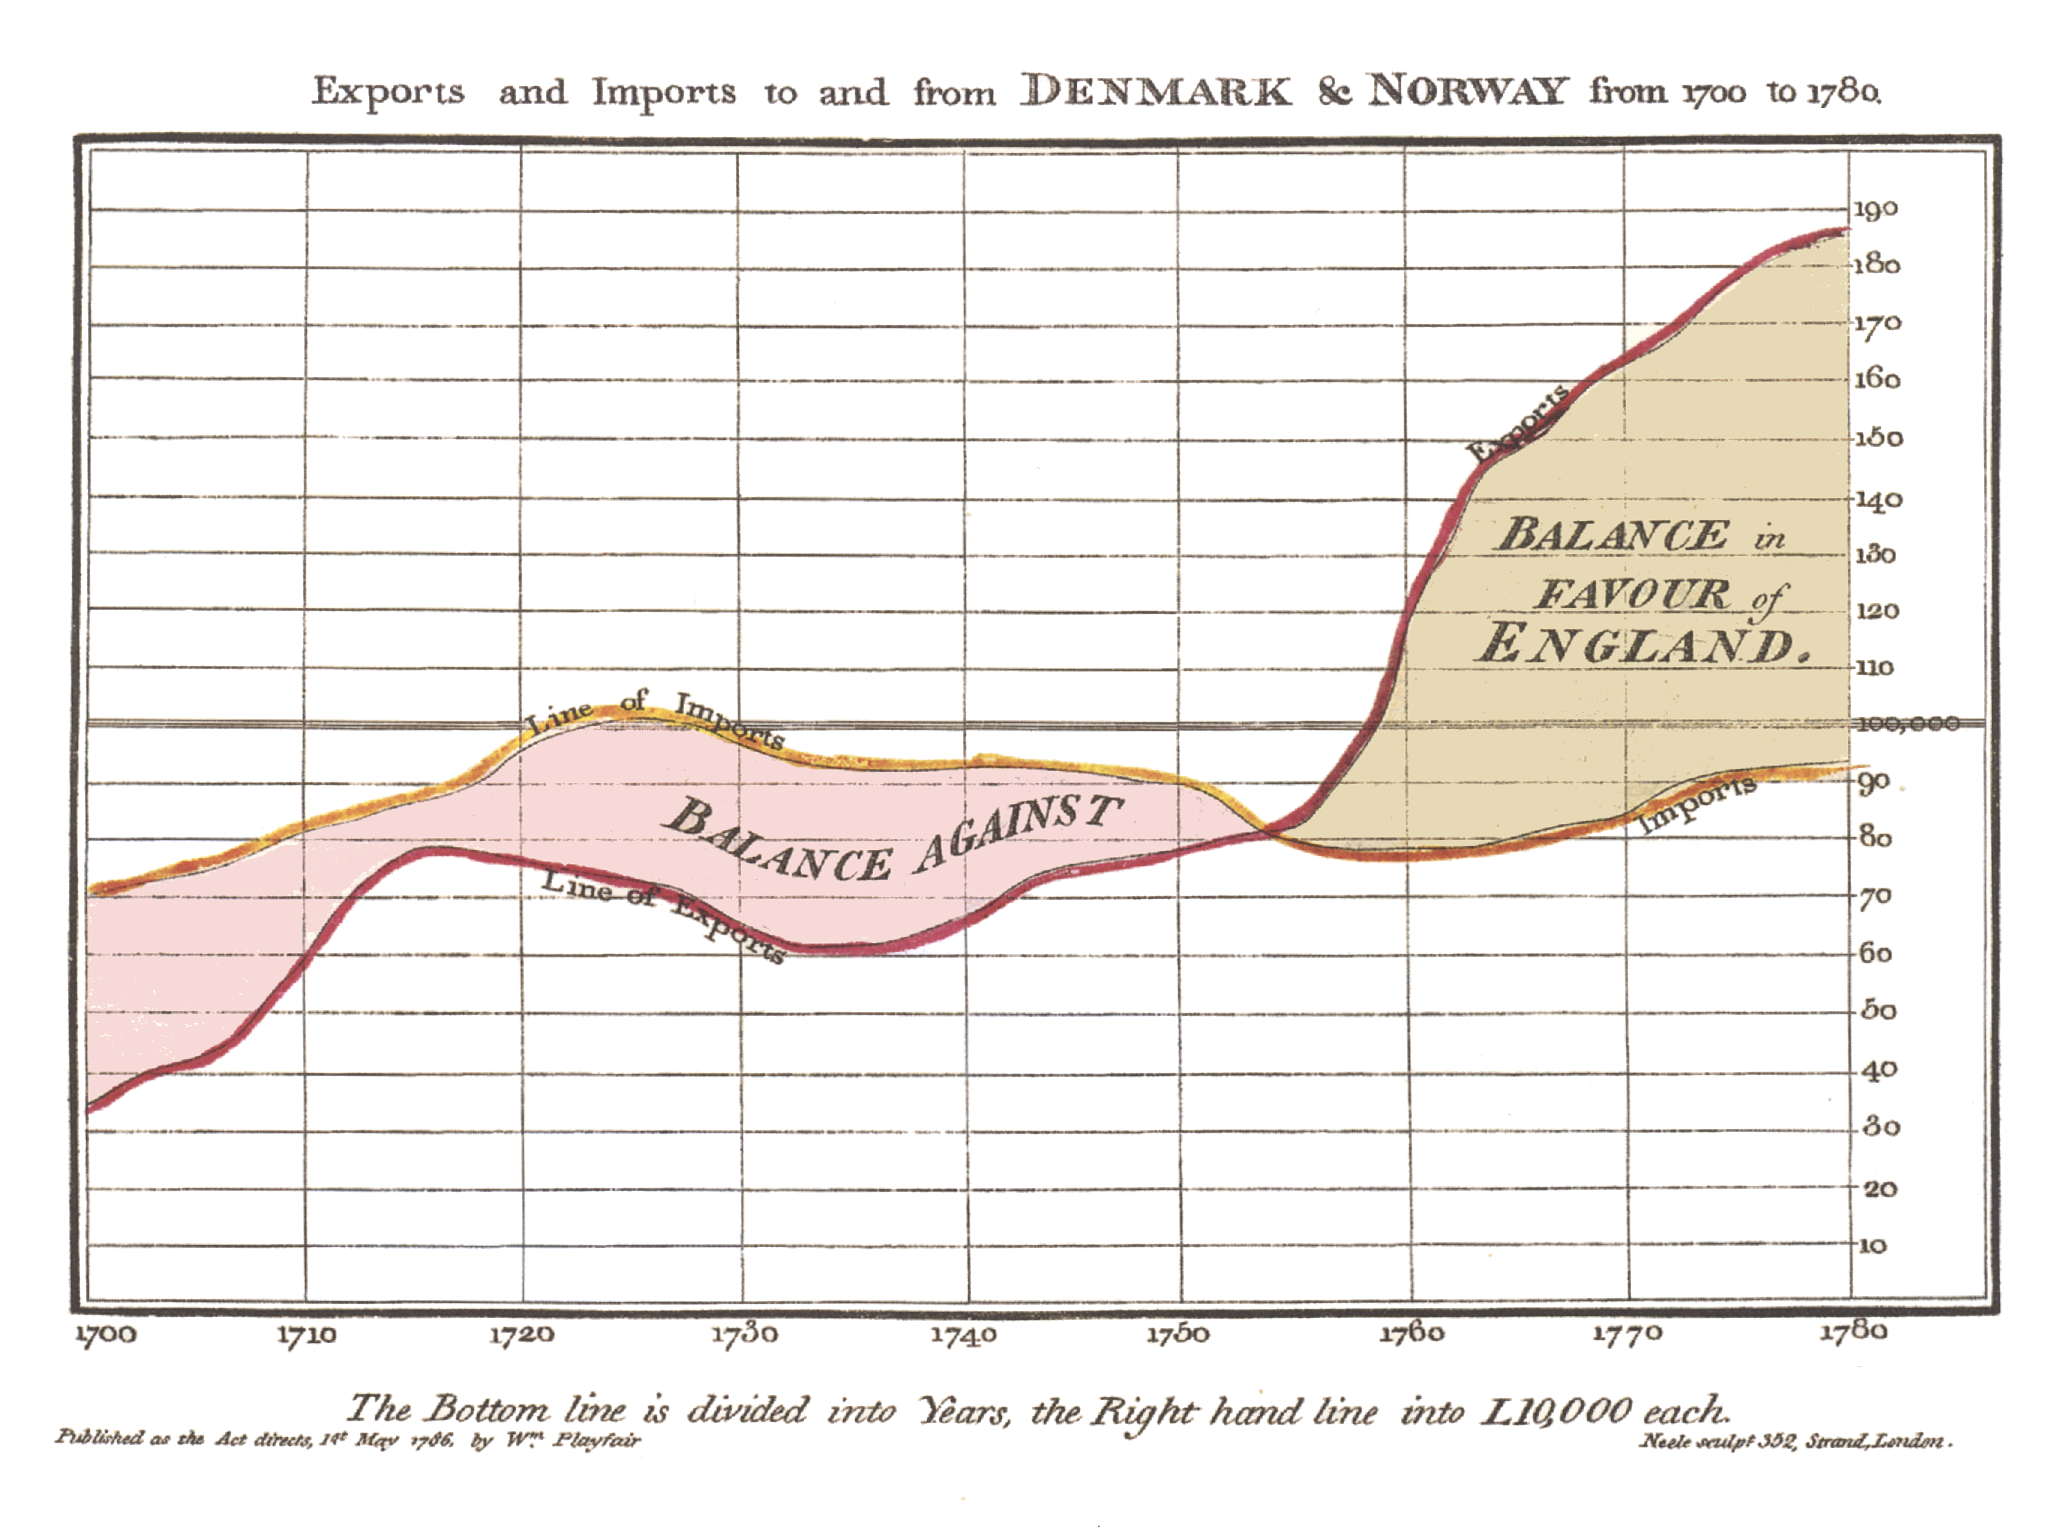
.small[1786]
---
### Joseph Priestley
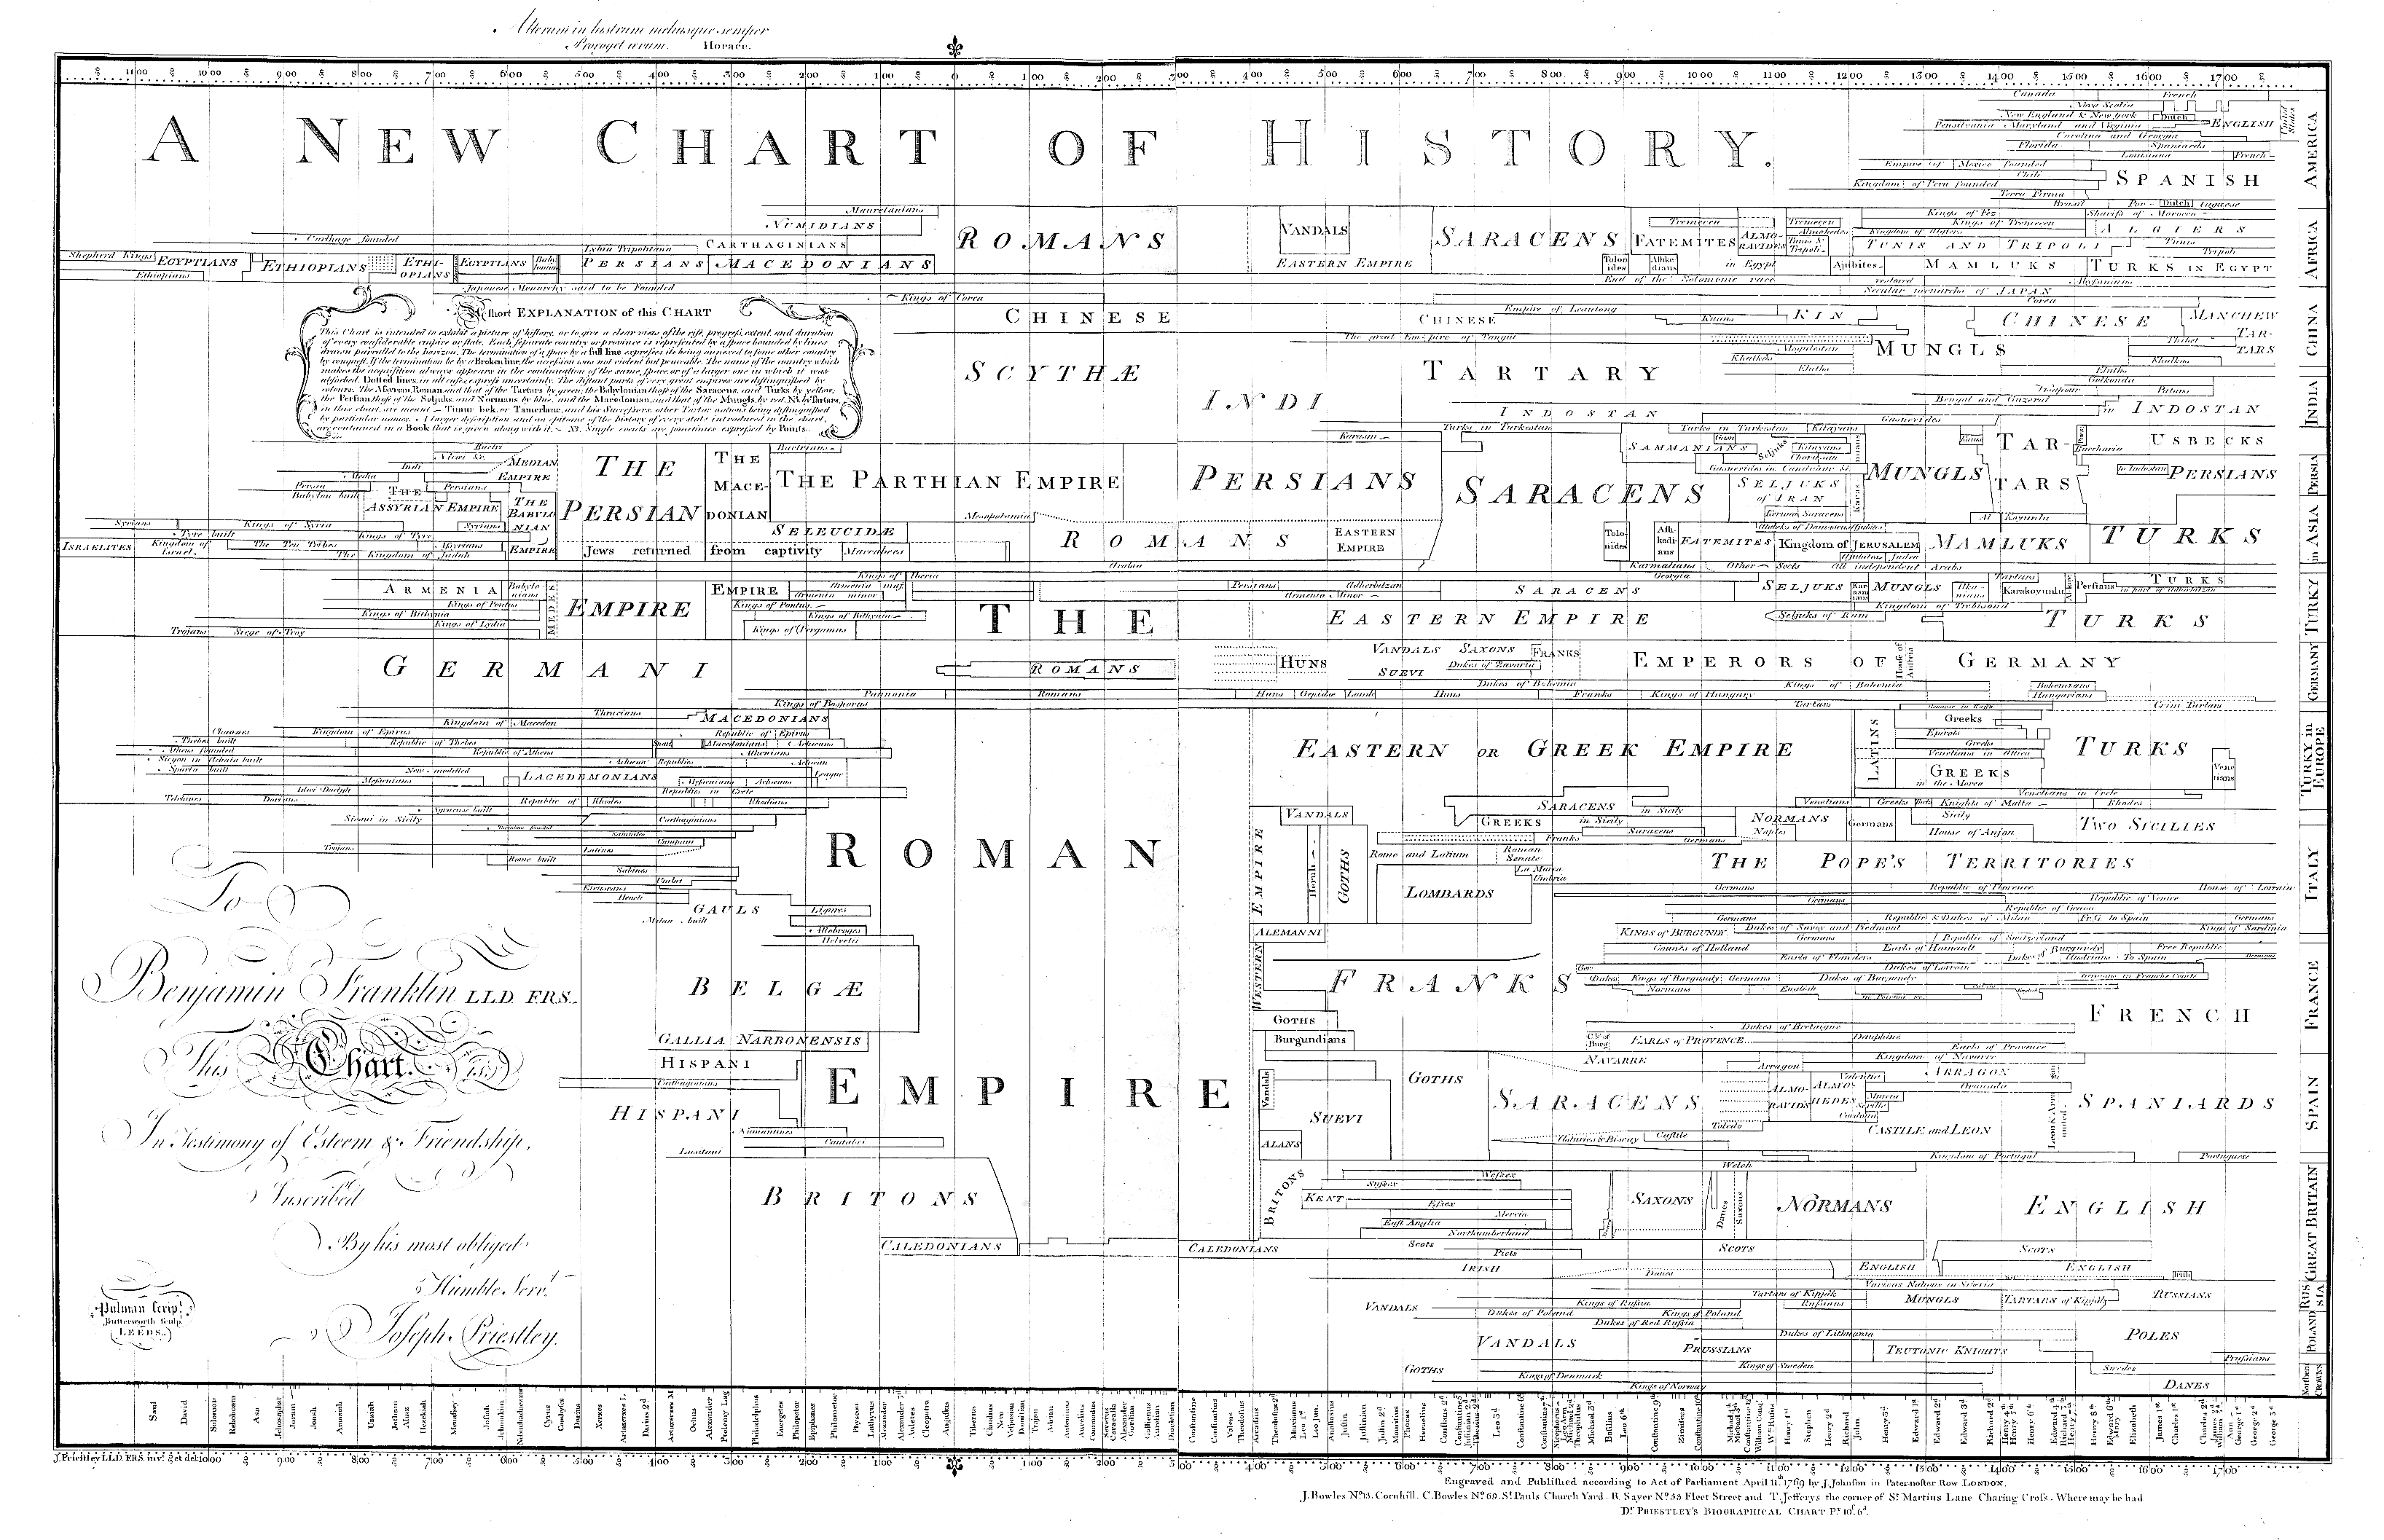
.small[1765]
---
### Florence Nightingale

.small[1858]
---
### Leonardo da Vinci
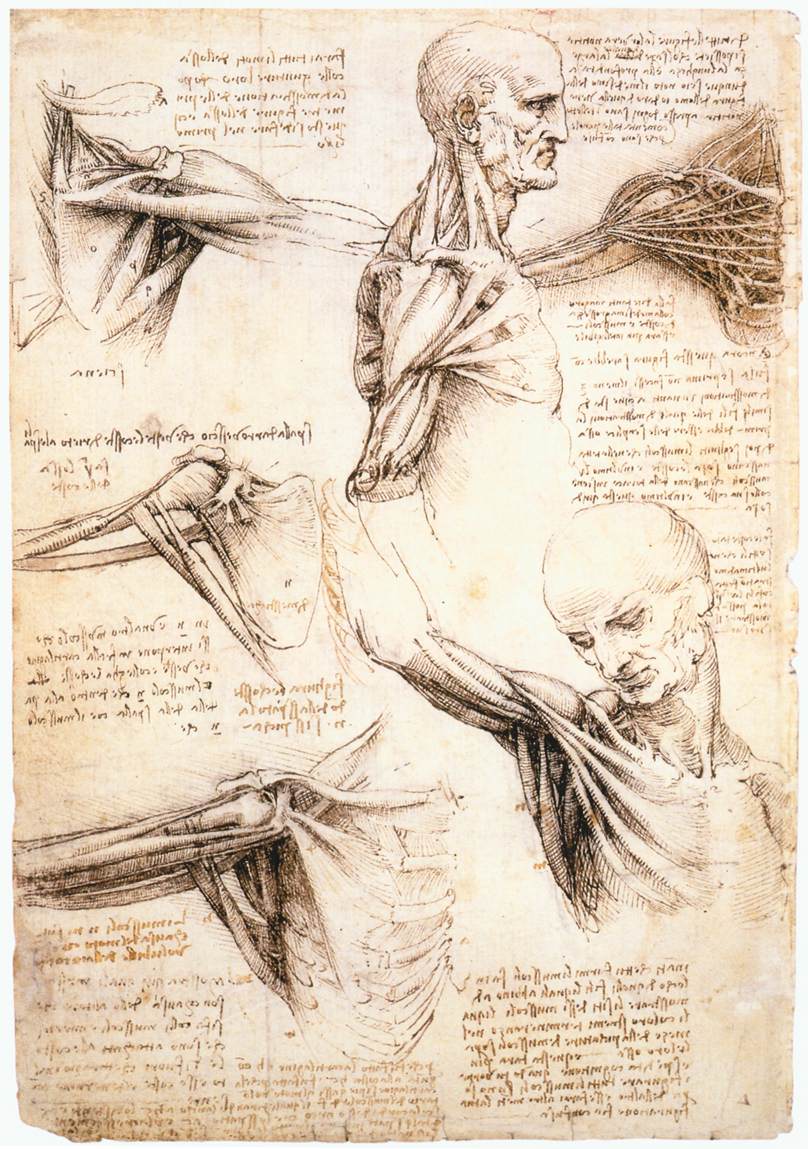
.small[1510]
---
# Visualization Today
---
### Israel Railways

---
### NTA

---
### Google Maps

---
### TA-35 Index

---
### ECG

---
### Scientific Research

.small[Longer Online Reviews are not Necessarily Better (Fink et. al. 2018)]
---
### Outliners
- Jackman, R. M. (1980). The impact of outliers on income inequality. American Sociological Review, 45, 344–47.
- Hewitt, C. (1977). The effect of political democracy and social democracy on equality in industrial societies: A cross-national comparison. American Sociological Review, 42, 450–64.

---
### Correlation vs. distribution
`r columns(1, 1)`
.scroll-output[
```{r , echo=FALSE, out.height="600px", cache=TRUE }
source("http://janhove.github.io/RCode/plot_r.R")
plot_r(r = 0.8, n = 50)
```
]
---
### What Makes Bad Figures Bad?
- Bad Taste
- maximize data-ink ratio
- memorable vs. interpretable
- Bad Data
- Bad Perception
- Tufte's Lie factor
---

---
### Nigel Holmes

---
- https://www.nytimes.com/2016/11/29/world/americas/western-liberal-democracy.html

---

---

---
### Cardiovascular System

---
Vis. provides a visual representation of objects that may include
- data
- algorithms
- results of computations
- processes
- user controls
- numerous other components of an application.
---
### Simulation Vis.

---
### Process Vis.

---
### Social Networks

---
### Agriculture (NDVI)

---
### Vis. and Other Fields
- Visualization vs. computer graphics
- scientific visualization and information visualization
---
### Role of the User
- user as designer
- user as explorer