Running Kubecost as a Prometheus metric exporter allows you to export various cost metrics to Prometheus without setting up any other Kubecost dependencies. Doing so lets you write PromQL queries to calculate the cost and efficiency of any Kubernetes concept, e.g. namespace, service, label, deployment, etc. You can also calculate the cost of different Kubernetes resources, e.g. nodes, PVs, LoadBalancers, and more. Finally, you can do other interesting things like create custom alerts via AlertManager and custom dashboards via Grafana.
Note: all deployments of Kubecost function as a Prometheus metric exporter. We strongly recommend helm as an install path to take advantage of Kubecost’s full potential. View recommended install.
If you would prefer to not use the recommended install option and just deploy the Kubecost open source cost model as a metric exporter, you can follow these steps:
-
Apply the combined YAML:
1.a.
wget https://raw.githubusercontent.com/kubecost/cost-model/develop/kubernetes/exporter/exporter.yaml1.b. On the line
value: "{{prometheusEndpoint}}" # The endpoint should have the form http://<service-name>.<namespace-name>.svcof
exporter.yaml, substitute your own Prometheus URI for{{prometheusEndpoint}}1.c.
kubectl apply -f exporter.yaml --namespace cost-modelIf you want to use a namespace other than
cost-model, you will have to edit theClusterRoleBindingafter applying the YAML to changesubjects[0].namespace. You can do this withkubectl edit clusterrolebinding cost-model. -
To verify that metrics are available:
kubectl port-forward --namespace cost-model service/cost-model 9003Visit http://localhost:9003/metrics to see exported metrics
Add Kubecost scrape config to Prom (more info)
- job_name: cost-model
  scrape_interval: 1m
  scrape_timeout: 10s
  metrics_path: /metrics
  scheme: http
  static_configs:
    - targets: ['cost-model.cost-model.:9003']
Done! Kubecost is now exporting cost metrics. See the following sections for different metrics available and query examples.
| Metric | Description |
|---|---|
| node_cpu_hourly_cost | Hourly cost per vCPU on this node |
| node_gpu_hourly_cost | Hourly cost per GPU on this node |
| node_ram_hourly_cost | Hourly cost per Gb of memory on this node |
| node_total_hourly_cost | Total node cost per hour |
| kubecost_load_balancer_cost | Hourly cost of a load balancer |
| kubecost_cluster_management_cost | Hourly management fee per cluster |
| container_cpu_allocation | Average number of CPUs requested over last 1m |
| container_memory_allocation_bytes | Average bytes of RAM requested over last 1m |
By default, all cost metrics are based on public billing APIs. See the Limitations section below about reflecting your precise billing information. Supported platforms are AWS, Azure, and GCP. For on-prem clusters, prices are based on configurable defaults.
More metrics are available in the recommended install path and are described in PROMETHEUS.md.
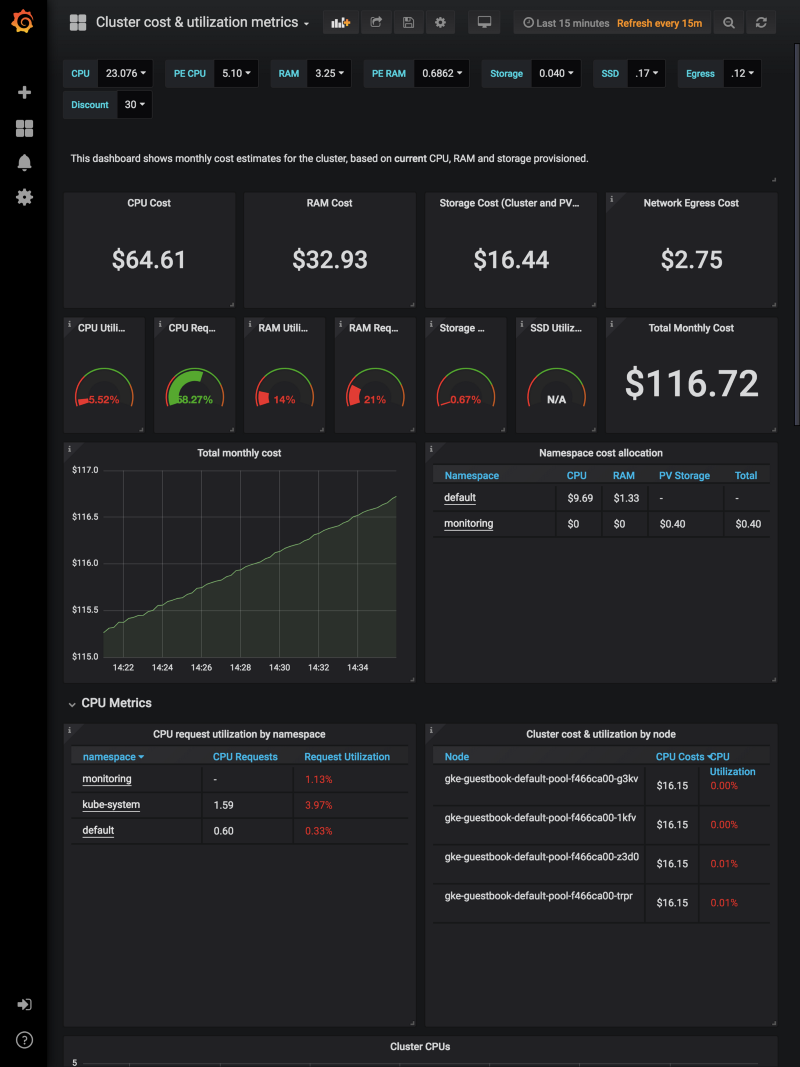
Here’s an example dashboard using Kubecost Prometheus metrics:
You can find other example dashboards at https://grafana.com/orgs/kubecost
Once Kubecost’s cost model is running in your cluster and you have added it in your Prometheus scrape configuration, you can hit Prometheus with useful queries like these:
sum(node_total_hourly_cost) * 730
sum(kubecost_load_balancer_cost) by (namespace)
sum(container_cpu_allocation * on (node) group_left node_cpu_hourly_cost) by (namespace) * 730
avg_over_time(container_memory_allocation_bytes{namespace="kube-system",pod=~"fluentd.*"}[1d])
  * on (pod,node) group_left
avg(count_over_time(container_memory_allocation_bytes{namespace="kube-system"}[1d:1m])/60) by (pod,node)
  * on (node) group_left
avg(avg_over_time(node_ram_hourly_cost[1d] )) by (node)
Custom cost alerts can be implemented with a set of Prometheus queries and can be used for alerting with AlertManager or Grafana alerts. Below are example alerting rules.
sum(node_total_hourly_cost) * 730 > 1000
Running Kubecost in exporter-only mode by definition limits functionality. The following limitations of this install method are addressed by the recommended install path.
- Persistent volume metrics not available (coming soon!)
- For large clusters, these Prometheus queries might not scale well over large time windows. We recommend using Kubecost APIs for these scenarios.
- Allocation metrics, like
container_cpu_allocationonly contain requests and do not take usage into account. - Related to the previous point, efficiency metrics are not available.
- Public billing costs on default. The standard Kubecost install and a cloud integration gives you accurate pricing based on your bill.
