Releases: d3/d3-shape
v1.0.5
v1.0.4
v1.0.3
v1.0.2
v1.0.1
v1.0.0
- First stable release.
Changes since D3 3.x
Pursuant to the great namespace flattening:
- d3.svg.line ↦ d3.line
- d3.svg.line.radial ↦ d3.radialLine
- d3.svg.area ↦ d3.area
- d3.svg.area.radial ↦ d3.radialArea
- d3.svg.arc ↦ d3.arc
- d3.svg.symbol ↦ d3.symbol
- d3.svg.symbolTypes ↦ d3.symbolTypes
- d3.layout.pie ↦ d3.pie
- d3.layout.stack ↦ d3.stack
- d3.svg.diagonal ↦ REMOVED (see d3/d3-shape#27)
- d3.svg.diagonal.radial ↦ REMOVED
Shapes are no longer limited to SVG; they can now render to Canvas! Shape generators now support an optional context: given a CanvasRenderingContext2D, you can render a shape as a canvas path to be filled or stroked. For example, a canvas pie chart might use an arc generator:
var arc = d3.arc()
    .outerRadius(radius - 10)
    .innerRadius(0)
    .context(context);
To render an arc for a given datum d:
context.beginPath();
arc(d);
context.fill();
See line.context, area.context and arc.context for more. Under the hood, shapes use d3-path to serialize canvas path methods to SVG path data when the context is null; thus, shapes are optimized for rendering to canvas. You can also now derive lines from areas. The line shares most of the same accessors, such as line.defined and line.curve, with the area from which it is derived. For example, to render the topline of an area, use area.lineY1; for the baseline, use area.lineY0.
4.0 introduces a new curve API for specifying how line and area shapes interpolate between data points. The line.interpolate and area.interpolate methods have been replaced with line.curve and area.curve. Curves are implemented using the curve interface rather than as a function that returns an SVG path data string; this allows curves to render to either SVG or Canvas. In addition, line.curve and area.curve now take a function which instantiates a curve for a given context, rather than a string. The full list of equivalents:
- linear ↦ d3.curveLinear
- linear-closed ↦ d3.curveLinearClosed
- step ↦ d3.curveStep
- step-before ↦ d3.curveStepBefore
- step-after ↦ d3.curveStepAfter
- basis ↦ d3.curveBasis
- basis-open ↦ d3.curveBasisOpen
- basis-closed ↦ d3.curveBasisClosed
- bundle ↦ d3.curveBundle
- cardinal ↦ d3.curveCardinal
- cardinal-open ↦ d3.curveCardinalOpen
- cardinal-closed ↦ d3.curveCardinalClosed
- monotone ↦ d3.curveMonotoneX
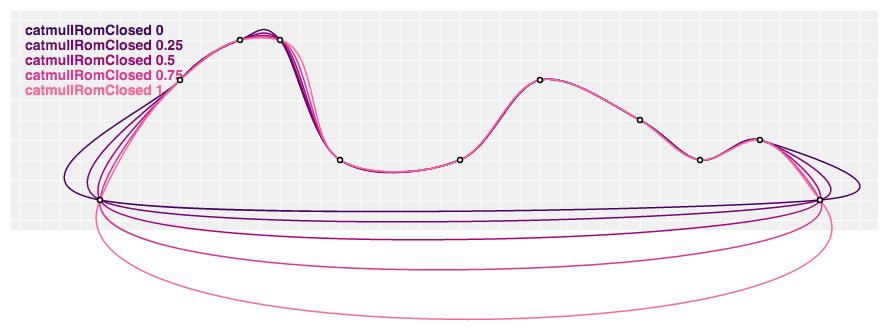
But that’s not all! 4.0 now provides parameterized Catmull–Rom splines as proposed by Yuksel et al.. These are available as d3.curveCatmullRom, d3.curveCatmullRomClosed and d3.curveCatmullRomOpen.
Each curve type can define its own named parameters, replacing line.tension and area.tension. For example, Catmull–Rom splines are parameterized using catmullRom.alpha and defaults to 0.5, which corresponds to a centripetal spline that avoids self-intersections and overshoot. For a uniform Catmull–Rom spline instead:
var line = d3.line()
    .curve(d3.curveCatmullRom.alpha(0.5));
4.0 fixes the interpretation of the cardinal spline tension parameter, which is now specified as cardinal.tension and defaults to zero for a uniform Catmull–Rom spline; a tension of one produces a linear curve. The first and last segments of basis and cardinal curves have also been fixed! The undocumented interpolate.reverse field has been removed. Curves can define different behavior for toplines and baselines by counting the sequence of curve.lineStart within curve.areaStart. See the d3.curveStep implementation for an example.
4.0 fixes numerous bugs in the monotone curve implementation, and introduces d3.curveMonotoneY; this is like d3.curveMonotoneX, except it requires that the input points are monotone in y rather than x, such as for a vertically-oriented line chart. The new d3.curveNatural produces a natural cubic spline. The default β for d3.curveBundle is now 0.85, rather than 0.7, matching the values used by Holten. 4.0 also has a more robust implementation of arc padding; see arc.padAngle and arc.padRadius.
4.0 introduces a new symbol type API. Symbol types are passed to symbol.type in place of strings. The equivalents are:
- circle ↦ d3.symbolCircle
- cross ↦ d3.symbolCross
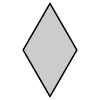
- diamond ↦ d3.symbolDiamond
- square ↦ d3.symbolSquare
- triangle-down ↦ REMOVED
- triangle-up ↦ d3.symbolTriangle
- ADDED ↦ d3.symbolStar
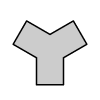
- ADDED ↦ d3.symbolWye
The full set of symbol types is now:
Lastly, 4.0 overhauls the stack layout API, replacing d3.layout.stack with d3.stack. The stack generator now longer needs an x-accessor. In addition, the API has been simplified: the stack generator now accepts tabular input, such as this array of objects:
var data = [
  {month: new Date(2015, 0, 1), apples: 3840, bananas: 1920, cherries: 960, dates: 400},
  {month: new Date(2015, 1, 1), apples: 1600, bananas: 1440, cherries: 960, dates: 400},
  {month: new Date(2015, 2, 1), apples:  640, bananas:  960, cherries: 640, dates: 400},
  {month: new Date(2015, 3, 1), apples:  320, bananas:  480, cherries: 640, dates: 400}
];
To generate the stack layout, first define a stack generator, and then apply it to the data:
var stack = d3.stack()
    .keys(["apples", "bananas", "cherries", "dates"])
    .order(d3.stackOrderNone)
    .offset(d3.stackOffsetNone);

var series = stack(data);
The resulting array has one element per series. Each series has one point per month, and each point has a lower and upper value defining the baseline and topline:
[
  [[   0, 3840], [   0, 1600], [   0,  640], [   0,  320]], // apples
  [[3840, 5760], [1600, 3040], [ 640, 1600], [ 320,  800]], // bananas
[[5760, 6720], [3040, 4000], [1600, 2240], [ 800, 1440]],...v0.7.1
v0.7.0
- Export to the global
d3in vanilla environments (d3/d3#2840).
v0.6.1
- Simpler symmetry for d3.curveStepAfter and d3.curveStepBefore.
- Relax null check in pie.sort.


