Crisp Status Reporter for Rust.
Crisp Status Reporter is used to actively submit health information to Crisp Status from your apps. Apps are best monitored via application probes, which are able to report detailed system information such as CPU and RAM load. This lets Crisp Status show if an application host system is under high load.
Include crisp-status-reporter in your Cargo.toml dependencies:
[dependencies]
crisp-status-reporter = "1.1"crisp-status-reporter can be instantiated as such:
extern crate crisp_status_reporter;

use std::time::Duration;
use crisp_status_reporter::Reporter;

// Build reporter
let reporter = Reporter::new("YOUR_TOKEN_SECRET")
  .service_id("YOUR_SERVICE_ID")      // Service ID containing the parent Node for Replica (given by Crisp)
  .node_id("YOUR_NODE_ID")            // Node ID containing Replica (given by Crisp)
  .replica_id("192.168.1.10")         // Unique Replica ID for instance (ie. your IP on the LAN)
  .interval(Duration::from_secs(30))  // Reporting interval (in seconds; defaults to 30 seconds if not set)
  .build();

// Run reporter (starts reporting)
reporter.run();Your private token can be found on your Crisp dashboard. Go to Settings, then Status Page, and then scroll down to "Configure your Status Reporter". Copy the secret token shown there, and use it while configuring this library in your application.
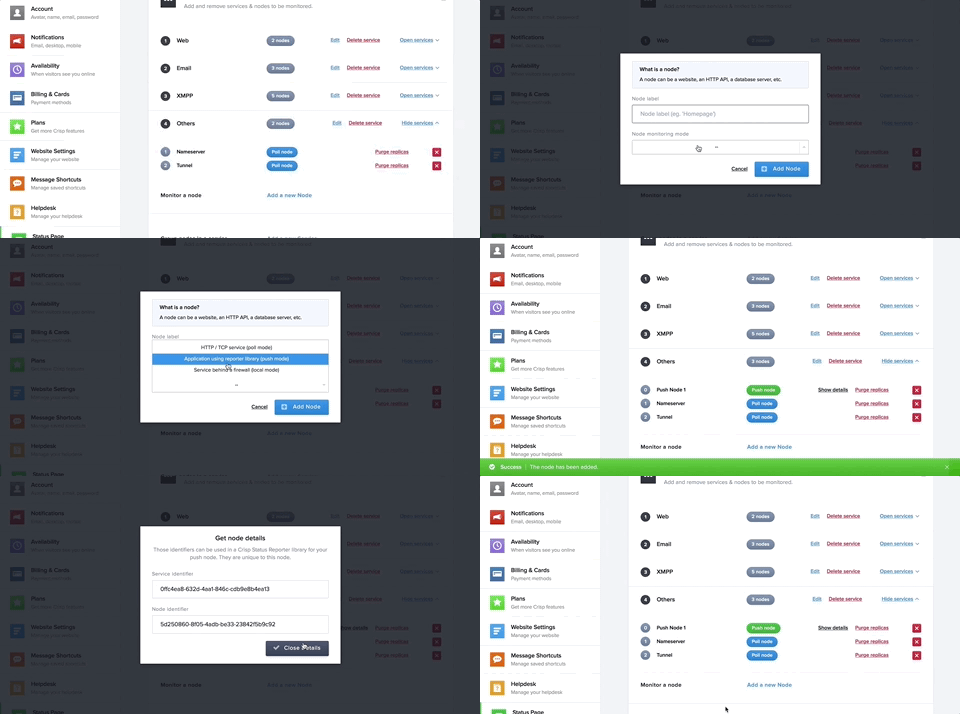
You can easily add a push node for the application running this library on your Crisp dashboard. Add the node, and retrieve its service_id and node_id as follows:
You can find more help on our helpdesk article: How to setup the Crisp Status Reporter library?
