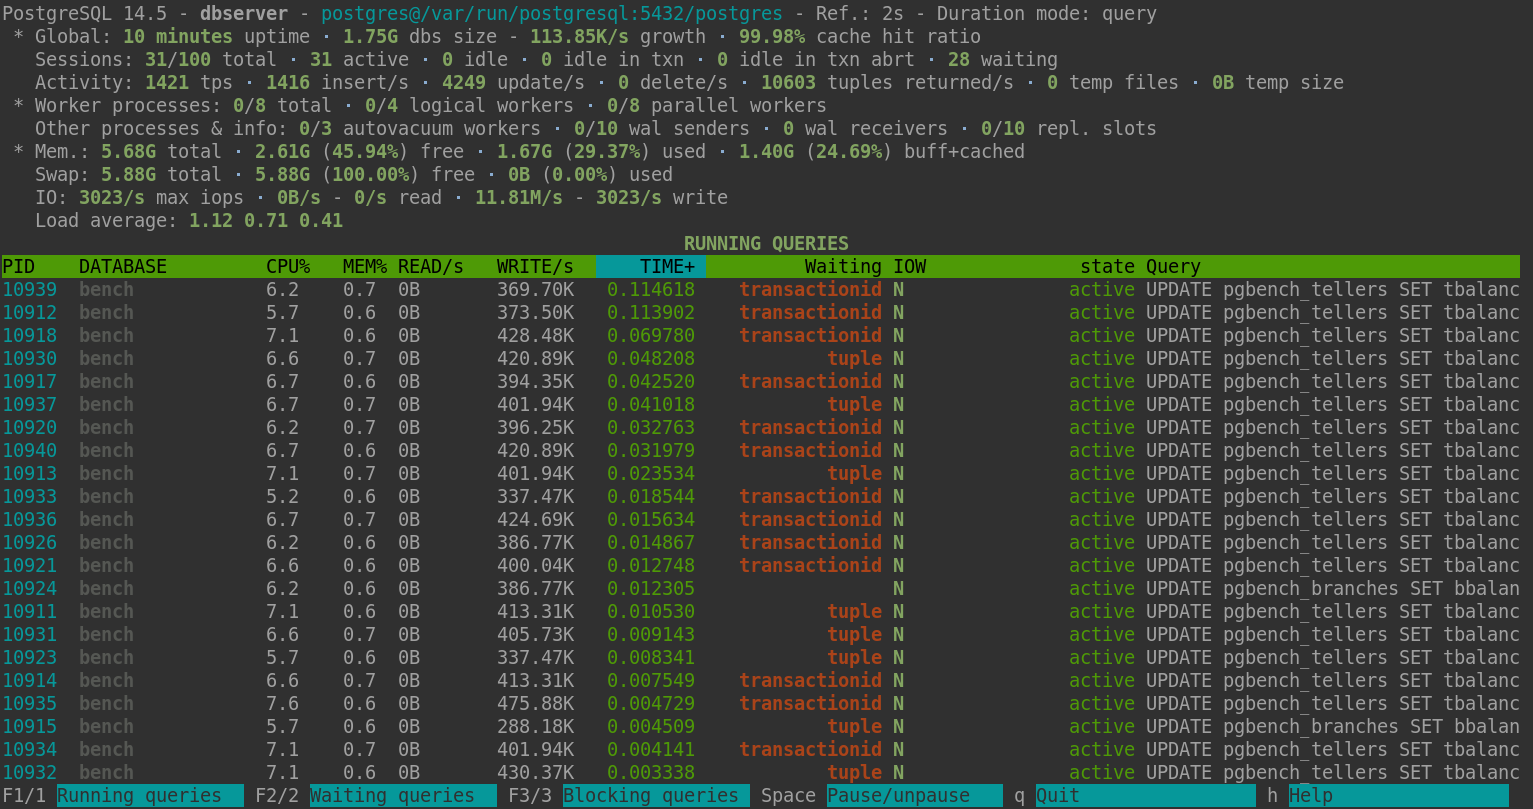
Command line tool for PostgreSQL server activity monitoring.
python≥ 2.6psycopg2≥ 2.2.1psutil≥ 0.5.1
Installation from sources:
setuptools ≥ 0.6.14
You have to install the package psycopg2 from pgdg APT or YUM repositories. psycopg2 can also been installed from pip with pip install psycopg2 or pip install psycopg2-binary for the binary version.
sudo python setup.py install
sudo python setup.py install --with-man
pg_activity works localy or remotely. In local execution context, to obtain sufficient rights to display system informations, the system user running pg_activity must be the same user running postgresql server (postgres by default), or have more rights like root. Otherwise, pg_activity can fallback to a degraded mode without displaying system informations. On the same way, PostgreSQL user used to connect to the database must be super-user.
ex:
sudo -u postgres pg_activity -U postgres
pg_activity [options]

Options:
    --version             Show program's version number and exit
    -U USERNAME, --username=USERNAME
                          Database user name (default: "postgres").
    -p PORT, --port=PORT  Database server port (default: "5432").
    -h HOSTNAME, --host=HOSTNAME
                          Database server host or socket directory (default:
                          "localhost").
    -d DBNAME, --dbname=DBNAME
                          Database name to connect to (default: "postgres").
    -C, --no-color        Disable color usage.
    --blocksize=BLOCKSIZE Filesystem blocksize (default: 4096).
    --rds                 Enable support for AWS RDS.
    --output=FILEPATH     Store running queries as CSV.
    --help                Show this help message and exit.
    --debug               Enable debug mode for traceback tracking.
    --no-db-size          Skip total size of DB.
    --min-duration        Don't display queries with smaller than specified
                          duration (in seconds).
    --verbose-mode=VERBOSE_MODE
                          Queries display mode. Values: 1-TRUNCATED,
                          2-FULL(default), 3-INDENTED
    --duration-mode=DURATION_MODE
                          Duration mode. Values: 1-QUERY(default),
                          2-TRANSACTION, 3-BACKEND


Display options, you can exclude some columns by using them :
    --no-database         Disable DATABASE.
    --no-user             Disable USER.
    --no-client           Disable CLIENT.
    --no-cpu              Disable CPU%.
    --no-mem              Disable MEM%.
    --no-read             Disable READ/s.
    --no-write            Disable WRITE/s.
    --no-time             Disable TIME+.
    --no-wait             Disable W.
    --no-app-name         Disable App.
Length of SQL query text that pg_activity reports relies on PostgreSQL parameter track_activity_query_size. Default value is 1024 (expressed in bytes). If your SQL query text look truncated, you should increase track_activity_query_size.
| Key | Action |
|---|---|
C |
Activate/deactivate colors |
r |
Sort by READ/s, descending |
w |
Sort by WRITE/s, descending |
c |
Sort by CPU%, descending |
m |
Sort by MEM%, descending |
t |
Sort by TIME+, descending |
T |
Change duration mode: query, transaction, backend |
Space |
Pause on/off |
v |
Change queries display mode: full, indented, truncated |
UP/DOWN |
Scroll processes list |
q |
Quit |
+ |
Increase refresh time. Maximum value : 5s |
- |
Decrease refresh time. Minimum Value : 0.5s |
F1/1 |
Running queries list |
F2/2 |
Waiting queries list |
F3/3 |
Blocking queries list |
h |
Help page |
R |
Refresh |
D |
Refresh Database Size (including when --no-dbzise option applied) |
| Key | Action |
|---|---|
UP |
Move up the cursor |
DOWN |
Move down the cursor |
k |
Terminate the current backend/tagged backends |
Space |
Tag or untag the process |
q |
Quit |
Other |
Back to activity |
I can't see my queries only TPS is shown
pg_activity scans the view pg_stat_activity with a user defined refresh
time comprised between O.5 and 5 seconds. It can be modified in the interface
with the + and - keys. Any query executed between two scans won't be
displayed.
What is more, pg_activity uses different queries to get :
- settings from
pg_settings - version info using
version() - queries and number of connections from
pg_stat_activity - locks from
pg_locks - tps from
pg_databaseusingpg_stat_get_db_xact_commit()andpg_stat_get_db_xact_rollback() - and more ( eg :
pg_cancel_backend()andpg_terminate_backend())
Thoses queries cannot be seen in the query tab because all queries issued from
the pg_activity backend are considered as noise and are not displayed . On
the other hand, the transactions used to get the info for pg_activity's
reporting are still accounted for by postgres in pg_stat_get_db_xact_commit()
and pg_stat_get_db_xact_commit(). Therefore pg_activity will display a non
zero TPS even with no activity on the database, and/or no activity displayed on
screen.


