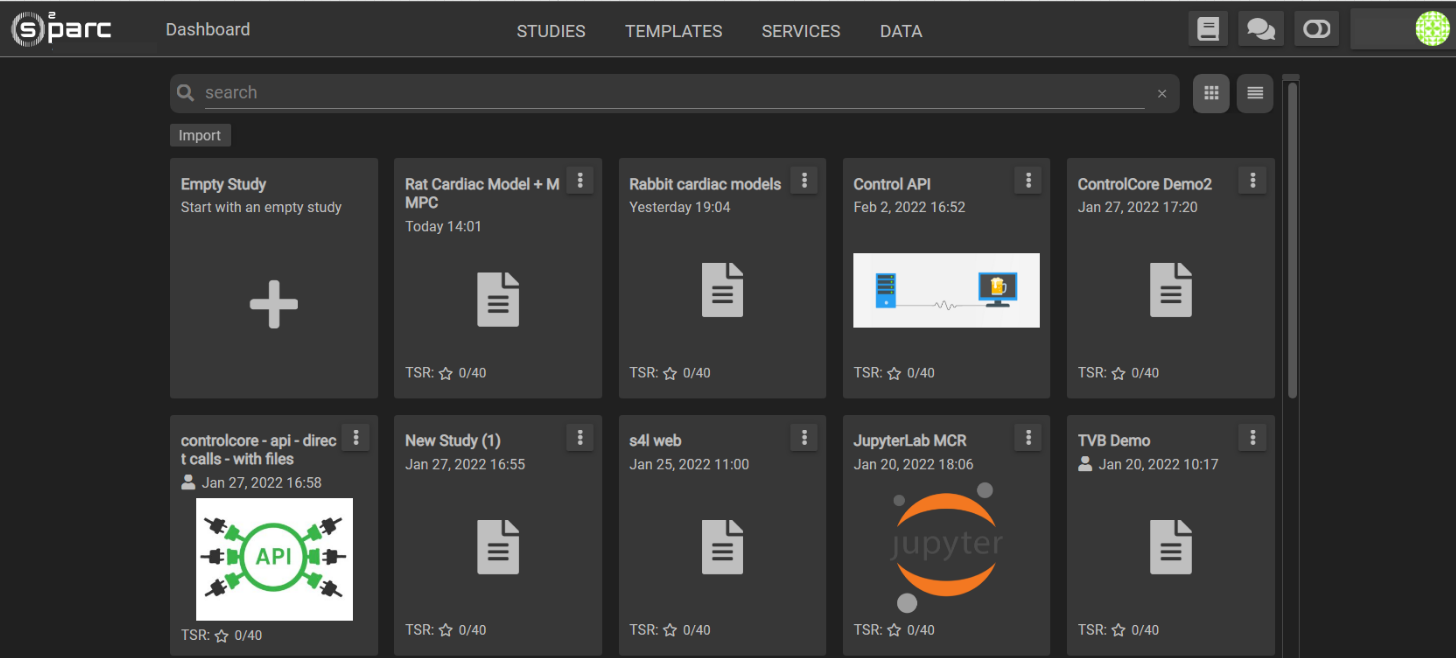
A code project on the online platform is called "Study". Any Study is accessible via the Dashboard either in the Studies (which belong to or are shared with you) or the Templates tab (for published Templated Studies).
There are a number of operations that are specific to Studies, accessible by the three dot button at the upper right hand corner of each Study.
These options are:
- Rename: allows you to rename the Study
- Study data: allows you to download data produced by your study
- Share: allows you to share your study with other users of the platform
- Duplicate allows you to create a copy of that Study (which will have the same name of the original study + "Copy")
-
More Options: brings up a modal window where you are able to view additional options for a Study including its description, sharing settings, quality metrics, Services contained, etc. - editing may also be possible if you have appropriate permissions.
-
Delete: as you may guess, this will delete the particular Study, with a confirmation popup. This will be allowed only if you are the Owner of a Study.
To learn about Study sharing and publishing, see Sharing and Publishing Studies
Double-clicking on a Study from the Dashboard will bring you to the Study's workbench. This is where you will create and edit your flow chart, see your Services, debug and run your Study.
The Workbench consists of four main windows, shown in the image below:
- Primary Column:
- In Nodes List tab, you can see the list of Services that are included in the Study and rename or delete them. To delete a Service, select the Service and then click the Delete button on the menu bar. You can also rename a Service by selecting a Service and clicking the rename button on the menu bar.
- In the Storage tab, you can browse all the data from any Study you have created.
- Secondary Column:
- When no Service is selected, this tab will show the Study metadata
- When a Service is selected as in the case of the image above, the inputs and output parameters of that service will be shown in separate tabs.
- Workbench Views:
- Pipeline: this is the default view of the pipeline, showing Services and their connections
- Interactive: when an Interactive Service is selected in the pipeline view or in the primary column, this tab will show the GUI for the Interactive Service
- Logger: this tab will display all messages pertinent to the running of your Study. These messages can be filtered by keywords/keyphrases entered into the “Filter” field.
- Run/Stop for pipelines containing Computational Services, the Run button is used to execute the pipeline while the Stop button can abort a running pipeline.
- Pipeline Workspace: when viewing the Pipeline tab, this is where you are able to create and edit the Study by adding new services, deleting services, and linking them together.
- Service: each Service is visible in the Pipeline workspace as a box with a name, input port, and/or an output port.
- Dashboard: when you have finished working with your Study, click on the Dashboard button to go back to your Homepages. While doing so, any changes you made to your study will be saved.


