As [Wikipedia] (https://en.wikipedia.org/wiki/Data_lake) describes
“A data lake is a method of storing data within a system that facilitates the colocation of data in variant schemas and structural forms, usually object blobs or files. The main challenge is not creating a data lake, but taking advantages of the opportunities it presents of unsiloed data”
To make it more IT Operations specific.
An IT Operational data lake is a method of storing and structuring IT landscape availability, performance, transaction and usability data and take the advantage to improve the quality and experience of customer journeys through your value chains. Which then can be seen as next-level chain monitoring awareness. Main opportunities are to become more proactive and even predictive in your monitoring approach by using it for diagnose, analytics and even machine learning. This dataset (using the metadata) can then be easily accessed by visualizations or alerting mechanisms.
To support all this functionality, we need tools and technology that near real-time can support big loads of monitoring data like events, metrics and health-states.
Our preferred tooling and technology choices for that are ELK (Elasticsearch-Logstash-Kibana) for events and Graphite/Grafana for your metrics. To easily integrate your monitoring within your application stacks we choose Kafka as message broker technology.
This workshop aims to be the one-stop shop for getting your hands dirty. Since this is a hands-on workshop we will start with easily installing the software components like Elasticsearch, Logstash, Kibana, Graphite and Grafana. Apart from the installation of our main components we will setup some of the code that is needed for setting up the data flow from log sources. We will end this with a simple, but effective dashboard. At the end we will setup some code that needed to near real-time send events and metrics without parsing it from log sources. Instead we will use the Kafka Broker technology. First we will simulate a Producer for events and metrics. At the end we will create consumers, which will put the normalized data in the data lake.
Even if you have no prior experience with these tools, this workshop should be all you need to get started.
This document contains a series of several sections, each of which explains a particular aspect of the data lake solution. In each section, you will be typing commands (or writing code). All the code used in the workshop is available in the [Github repo] (https://github.com/avwsolutions/DOD-AMS-Workshop).
- Preface
- 1.0 Installing and initial configuration of the first components
- 2.0 BankIT Scenario : part1
- 3.0 BankIT Scenario : part2
- 4.0 BankIT Scenario : part3
- 4.1 Install & configure Kafka
- 4.2 Create your Kafka Logstash configuration
- [4.3 Direct application logging through Java workers] (#directlog)
Note: This workshop uses the folowing versions.
- Elasticsearch, version 2.3.3
- Logstash, version 2.3.3
- Kibana, version 4.5.1
- CollectD, version 5.5.1
- Graphite, version 0.9.15
- Grafana, version 3.0.4
- Kafka, version .0.10.0.0
If you find any part of the workshop exercises incompatible with a future version, please raise an issue. Thanks!
There are no specific skills needed for this workshop beyond a basic comfort with the command line and using a text editor. Prior experience in implementing monitoring applications will be helpful but is not required. As you proceed further along the workshop, we'll make use of Github.
Setting up a consistent test environment can be a time consuming task, but thankfully with use of Vagrant this is a very easy task. Benefits of Vagrant are the consistent workflow and the easiness of environment lifecycle, like disposal. The installation and getting started guide has detailed instructions for setting up Vagrant on Mac, Linux and Windows.
To spin off the VM go to the directory where you saved the .box & Vagrantfile and run the following commands
$vagrant up
Bringing machine 'datalake' up with 'virtualbox' provider...
==> datalake: Importing base box 'DOD-AMS-WORKSHOP'...
==> datalake: Matching MAC address for NAT networking...
==> datalake: Setting the name of the VM: DOD-AMS_datalake_1466797115802_30773
==> datalake: Clearing any previously set network interfaces...
==> datalake: Preparing network interfaces based on configuration...
    datalake: Adapter 1: nat
    datalake: Adapter 2: hostonly
==> datalake: Forwarding ports...
    datalake: 22 (guest) => 10123 (host) (adapter 1)
    datalake: 80 (guest) => 9080 (host) (adapter 1)
    datalake: 5601 (guest) => 5601 (host) (adapter 1)
    datalake: 3000 (guest) => 3000 (host) (adapter 1)
    datalake: 2003 (guest) => 2003 (host) (adapter 1)
    datalake: 2003 (guest) => 2003 (host) (adapter 1)
    datalake: 9200 (guest) => 9200 (host) (adapter 1)
    datalake: 2003 (guest) => 2181 (host) (adapter 1)
    datalake: 2003 (guest) => 9092 (host) (adapter 1)
==> datalake: Booting VM...
==> datalake: Waiting for machine to boot. This may take a few minutes...
    datalake:** SSH address: 127.0.0.1:10123**
    datalake:** SSH username: vagrant**
    datalake:** SSH auth method: private key**
    datalake:
    datalake: Vagrant insecure key detected. Vagrant will automatically replace
    datalake: this with a newly generated keypair for better security.
    datalake:
    datalake: Inserting generated public key within guest...
    datalake: Removing insecure key from the guest if it's present...
    datalake: Key inserted! Disconnecting and reconnecting using new SSH key...
==> datalake: Machine booted and ready!
==> datalake: Checking for guest additions in VM...
    datalake: No guest additions were detected on the base box for this VM! Guest
    datalake: additions are required for forwarded ports, shared folders, host only
    datalake: networking, and more. If SSH fails on this machine, please install
    datalake: the guest additions and repackage the box to continue.
    datalake:
    datalake: This is not an error message; everything may continue to work properly,
    datalake: in which case you may ignore this message.
==> datalake: Setting hostname...
==> datalake: Configuring and enabling network interfaces...
==> datalake: Mounting shared folders...
    datalake: /home/vagrant/sync => /Users/avwinbox/VagrantBoxes/DOD-AMS
Note: For Windows user the ssh command isn't available by default. You can PuTTY to connect to the local created VM by address 127.0.0.1 with port 10123. Default username & password are 'vagrant/vagrant'
$vagrant ssh
Last login: Sun Jun 19 21:00:06 2016
-bash: warning: setlocale: LC_CTYPE: cannot change locale (UTF-8): No such file or directory
[vagrant@datalake ~]$
Now that you have everything setup, it's time to get our hands dirty. In this first section you will install and setup all first used tools. For this some configuration templates be helpful, which are part of the DOD-AMS-Workshop repository.
Note : Be aware that for this task internet connectivity is needed. For convenience there is already a cache version available.
To get started type the following commands in your terminal.
$ sudo su -
# cd /usr/local/src
# git clone https://github.com/avwsolutions/DOD-AMS-Workshop
Note : Elastic recommends using Oracle Java over OpenJDK. In this workshop we will use OpenJDK which also is supported.
Below you will find the commands for installing the openJDK JRE and checking if the path & version (1.7 or greater) are correct.
$ sudo yum -y install jre
$ sudo java -version
openjdk version "1.8.0_91"
OpenJDK Runtime Environment (build 1.8.0_91-b14)
OpenJDK 64-Bit Server VM (build 25.91-b14, mixed mode)
Note : Be aware that for this task internet connectivity is needed. For convenience the Elastic repository is configured and there is already a cache yum download available.
Below you will find the command for installing elasticsearch.
$ sudo yum -y install elasticsearch
Now we will configure the elasticsearch instance to only accept local port access. Be aware of this when connecting from your Computer.
$ sudo vi /etc/elasticsearch/elasticsearch.yml
Add the uncommented line to the YML file.
# Set the bind address to a specific IP (IPv4 or IPv6):
#
# network.host: 192.168.0.1
network.host: localhost
#
# Set a custom port for HTTP:
#
# http.port: 9200
Since we run a local firewall we need to enable access to the port
$ sudo su -
# cd /usr/lib/firewalld/services
# vi elasticsearch.xml

<?xml version="1.0" encoding="utf-8"?>
<service>
  <short>Elasticsearch</short>  <description>Elasticsearch server REST API, which is based on http traffic.</description>
  <port protocol="tcp" port="9200"/>
</service>

# firewall-cmd --permanent --add-service elasticsearch
# firewall-cmd --reload
Finally we will configure the service configuration and start the service. Notice it is using systemd
$ sudo systemctl daemon-reload
$ sudo systemctl enable elasticsearch.service
$ sudo systemctl start elasticsearch.service
Note : Be aware that for this task internet connectivity is needed. For convenience the Elastic repository is configured and there is already a cache yum download available.
Below you will find the command for installing logstash.
$ sudo yum -y install logstash
Finally we will configure the service configuration. Notice it is not using systemd.
$ sudo systemctl daemon-reload
$ sudo systemctl enable logstash.service
Note : Be aware that for this task internet connectivity is needed. For convenience the Elastic repository is configured and there is already a cache yum download available.
Below you will find the command for installing kibana.
$ sudo yum -y install kibana
Since we run a local firewall we need to enable access to the port
$ sudo su -
# cd /usr/lib/firewalld/services
# vi kibana.xml

<?xml version="1.0" encoding="utf-8"?>
<service>
  <short>Kibana</short>  <description>Kibana Appl server, which is based on http traffic.</description>
  <port protocol="tcp" port="5601"/>
</service>

# firewall-cmd --permanent --add-service kibana
# firewall-cmd --reload
Finally we will configure the service configuration. Notice it is using systemd.
$ sudo systemctl daemon-reload
$ sudo systemctl enable kibana.service
$ sudo systemctl start kibana.service
Note : Be aware that for this task internet connectivity is needed. For convenience the Epel repository is configured and there is already a cache yum download available.
Below you will find the commands for installing Graphite. As you can see we need to install quite some dependencies in order to get Graphite working. The two following commands are needed to install the dependencies,mandatory web server, python tools and compilers.
$ sudo yum -y install httpd gcc gcc-c++ git pycairo mod_wsgi epel-release
$ sudo yum -y install python-pip python-devel blas-devel lapack-devel libffi-devel
Now we will download the latest graphite packages from github.
Note : Be aware that for this task internet connectivity is needed. For convenience there is already a cache version available.
$ sudo su -
# cd /usr/local/src
# git clone https://github.com/graphite-project/graphite-web.git
# git clone https://github.com/graphite-project/carbon.git
Now that we have the sources we are ready to install the binaries. This can be done with the pip command. Since there are some changes "[syncdb deprecated]"(https://docs.djangoproject.com/en/1.7/topics/migrations/) in Django 1.9.x release, it is mandatory to first update the requirements.txt input file.
$ sudo su -
# vi /usr/local/src/graphite-web/requirements.txt

# old value => Django>=1.4
Django==1.8
Now start the pip installer.
$ sudo su -
# pip install -r /usr/local/src/graphite-web/requirements.txt

#verify if Django has the right version

# python
Python 2.7.5 (default, Nov 20 2015, 02:00:19)
[GCC 4.8.5 20150623 (Red Hat 4.8.5-4)] on linux2
Type "help", "copyright", "credits" or "license" for more information.
>>> import django
>>> django.VERSION
(1, 8, 0, 'final', 0)
>>> quit()
Next steps are needed for running the setup script for installing carbon.
$ sudo su -
# cd /usr/local/src/carbon/
# python setup.py install
Now repeat these steps for graphite-web.
$ sudo su -
# cd /usr/local/src/graphite-web/
# python setup.py install
Copy all template configurations for graphite-web and carbon-*.
$ sudo cp /opt/graphite/conf/carbon.conf.example /opt/graphite/conf/carbon.conf
$ sudo cp /opt/graphite/conf/storage-schemas.conf.example /opt/graphite/conf/storage-schemas.conf
$ sudo cp /opt/graphite/conf/storage-aggregation.conf.example /opt/graphite/conf/storage-aggregation.conf
$ sudo cp /opt/graphite/conf/relay-rules.conf.example /opt/graphite/conf/relay-rules.conf
$ sudo cp /opt/graphite/conf/aggregation-rules.conf.example /opt/graphite/conf/aggregation-rules.conf
$ sudo cp /opt/graphite/webapp/graphite/local_settings.py.example /opt/graphite/webapp/graphite/local_settings.py
$ sudo cp /opt/graphite/conf/graphite.wsgi.example /opt/graphite/conf/graphite.wsgi
$ sudo cp /opt/graphite/examples/example-graphite-vhost.conf /etc/httpd/conf.d/graphite.conf
Copy the service startup scripts and make them executable.
$ sudo cp /usr/local/src/carbon/distro/redhat/init.d/carbon-* /etc/init.d/
$ sudo chmod +x /etc/init.d/carbon-*
Now it is time to configure graphite-web component. This step is import because we will now create the local SQLite DB file for graphite-web, which is for administrative purposes. Don't be confused this is not the database where the metrics are stored.To have minimized security you're asked to fill in the username and password. Please leave the username default 'root' and choose 'password' as password.
$ sudo su -
# cd /opt/graphite
# PYTHONPATH=/opt/graphite/webapp/ django-admin.py syncdb --settings=graphite.settings
Response : Yes, accept default 'root', leave the email address 'empty' and use 'password' as password.
The static content will be generated. Also don't forget to set the correct owner for the httpd server.
Note : Currently we are running in SELinux Permissive mode instead of Enforcing.In production environments always move your webserver content to the /var/www/html or implement the correct SELinux acccess control Security contexts.
$ sudo su -
# cd /opt/graphite
# PYTHONPATH=/opt/graphite/webapp/ django-admin.py collectstatic --settings=graphite.settings

# chown -R apache:apache /opt/graphite/storage/
# chown -R apache:apache /opt/graphite/static/
# chown -R apache:apache /opt/graphite/webapp/
Now we have to update the firewall configuration again.
$ sudo su -
# cd /usr/lib/firewalld/services
# vi carbonrelay.xml

<?xml version="1.0" encoding="utf-8"?>
<service>
  <short>Carbon-relay</short>  <description>Port for retrieving metrics for various sources.</description>
  <port protocol="tcp" port="2003"/>
  <port protocol="udp" port="2003"/>
</service>

# firewall-cmd --permanent --add-service http
# firewall-cmd --permanent --add-service carbonrelay
# firewall-cmd --reload
Since the default virtual host configuration template for httpd is not working due CentOS restrictions (httpd 2.4), we have to add some additional configuration.
Correct configuration
- Add the following configuration for the '/opt/graphite/static' directory
<Directory /opt/graphite/static/>
 	<IfVersion < 2.4>
                         Order deny,allow
                         Allow from all
                 </IfVersion>
                 <IfVersion >= 2.4>
                         Require all granted
                 </IfVersion>
         </Directory>
- And uncomment the following lines
	# WSGIScriptAlias /graphite /srv/graphite-web/conf/graphite.wsgi/graphite
        # Alias /graphite/static /opt/graphite/webapp/content
        #  <Location "/graphite/static/">
        #        SetHandler None
        # </Location>
$ sudo vi /etc/httpd/conf.d/graphite.conf
...

<VirtualHost *:80>
        ServerName graphite
        DocumentRoot "/opt/graphite/webapp"
        ErrorLog /opt/graphite/storage/log/webapp/error.log
        CustomLog /opt/graphite/storage/log/webapp/access.log common

        # I've found that an equal number of processes & threads tends
        # to show the best performance for Graphite (ymmv).
        WSGIDaemonProcess graphite processes=5 threads=5 display-name='%{GROUP}' inactivity-timeout=120
        WSGIProcessGroup graphite
        WSGIApplicationGroup %{GLOBAL}
        WSGIImportScript /opt/graphite/conf/graphite.wsgi process-group=graphite application-group=%{GLOBAL}

        # XXX You will need to create this file! There is a graphite.wsgi.example
        # file in this directory that you can safely use, just copy it to graphite.wgsi
        WSGIScriptAlias / /opt/graphite/conf/graphite.wsgi


        # XXX To serve static files, either:
        # * Install the whitenoise Python package (pip install whitenoise)
        # * Collect static files in a directory by running:
        #     django-admin.py collectstatic --noinput --settings=graphite.settings
        #   And set an alias to serve static files with Apache:
        Alias /static/ /opt/graphite/static/

        <Directory /opt/graphite/static/>
        <IfVersion < 2.4>
                        Order deny,allow
                        Allow from all
                </IfVersion>
                <IfVersion >= 2.4>
                        Require all granted
                </IfVersion>
        </Directory>
        ########################
        # URL-prefixed install #
        ########################
        # If using URL_PREFIX in local_settings for URL-prefixed install (that is not located at "/"))
        # your WSGIScriptAlias line should look like the following (e.g. URL_PREFX="/graphite"

        WSGIScriptAlias /graphite /srv/graphite-web/conf/graphite.wsgi/graphite
        Alias /graphite/static /opt/graphite/webapp/content
        <Location "/graphite/static/">
               SetHandler None
        </Location>
	# XXX In order for the django admin site media to work you
        # must change @DJANGO_ROOT@ to be the path to your django
        # installation, which is probably something like:
        # /usr/lib/python2.6/site-packages/django
        Alias /media/ "@DJANGO_ROOT@/contrib/admin/media/"

        # The graphite.wsgi file has to be accessible by apache. It won't
        # be visible to clients because of the DocumentRoot though.
        <Directory /opt/graphite/conf/>
                <IfVersion < 2.4>
                        Order deny,allow
                        Allow from all
                </IfVersion>
                <IfVersion >= 2.4>
                        Require all granted
                </IfVersion>
        </Directory>

</VirtualHost>
Finally we will configure the service configuration. Notice it is not using systemd.
$ sudo systemctl daemon-reload
$ sudo systemctl enable httpd.service
$ sudo systemctl start httpd.service
$ curl http://localhost
$ sudo systemctl enable carbon-relay
$ sudo systemctl enable carbon-aggregator
$ sudo systemctl enable carbon-cache
$ sudo systemctl start carbon-relay
$ sudo systemctl start carbon-aggregator
$ sudo systemctl start carbon-cache
Note : Be aware that for this task internet connectivity is needed. For convenience the Grafana repository is configured and there is already a cache yum download available.
Below you will find the command for installing grafana.
$ sudo yum -y install grafana
Since we run a local firewall we need to enable access to the port
$ sudo su -
# cd /usr/lib/firewalld/services
# vi grafana.xml

<?xml version="1.0" encoding="utf-8"?>
<service>
  <short>Grafana</short>  <description>Grafana Appl server, which is based on http traffic.</description>
  <port protocol="tcp" port="3000"/>
</service>

# firewall-cmd --permanent --add-service grafana
# firewall-cmd --reload
Finally we will configure the service configuration. Notice it is using systemd.
$ sudo systemctl daemon-reload
$ sudo systemctl enable grafana-server.service
$ sudo systemctl start grafana-server.service
$ curl http://localhost:3000/login
You are hired as an experienced Engineer at a new FINTEC startup, named Bank IT. You are part of the DevOps team which delivers the core Cloud Platform and is used by the BankIT application. Within the current sprint you are designated to help Kenny setting up the ITOps data lake. Kenny already has defined the functional requirements, but lacks the technical skills to do the implementation.
BankIT itself is a web based application, which has Tomcat application server as Middleware and Linux as Operating System. In this use case we have to gather the events from the Middleware and Operating System.
Below the functional requirements:
- All Operating System messages (syslog) must be available in the data lake.
- All Middleware messages must be available in the data lake.
- Security related messages (facility 4/10 - audit, ) must be masked.
- Original timestamp must be used from source ( not on arrival )
- Application context must be added, either Functional or Technical.
- Customer privacy-sensitive messages must be excluded from the data lake.
- All messages that not match a pattern must be traceable for optimalization.
Now it is finally time to play around with logstash. If you never used logstash, these excercises are there to get familiar with the syntax.If you are familiar skip this section and start at 2.2 Connecting the syslog
Do your first inline code with LogStash using your standard input (command) and output (screen) channels.
$ /opt/logstash/bin/logstash -e 'input { stdin { } } output { stdout {} }'
After the logstash agent is initialized, it is waiting for input. Now type in 'Hello DevOpsDays AMS2016' and press . You will see logstash respond to that command with a message:
Settings: Default pipeline workers: 1
Pipeline main started
Hello DevOpsDays AMS2016
2016-06-25T02:16:59.848Z datalake.monitor.now Hello DevOpsDays AMS2016
Now close the worker CTRL-C and add some additional code. Can you spot the difference ?
/opt/logstash/bin/logstash -e 'input { stdin { } } filter { mutate { gsub => [ "message","DevOpsDays.*","Student" ] } }output { stdout { codec => json } }'
You will see logstash respond to that command with a message.
Settings: Default pipeline workers: 1
Pipeline main started
Hello DevOpsDays AMS2016
{"message":"Hello Student","@version":"1","@timestamp":"2016-06-25T02:28:36.809Z","host":"datalake.monitor.now"}
Final thing I want to demonstrate is the use of conditional support. As with programming languages the if/if else/else can be used with a chosen expression. First create a directory, for example '/tmp/example' and create three files as listed below.
Note : Logstash can run code from one file or a directory which we show below. Be aware of the correct naming that input code is always imported first.
000-input.conf

input { stdin { } }
500-filter.conf

filter {
	if [message] == "carrot" {
     		mutate { add_field => { "guess" => "You are a Bugs Bunny" } }
	} else if [message] == "pizza" {
     		mutate { add_field => { "guess" => "You are Mario Bros" } }
	} else if [message] == "beer" {
                mutate { add_field => { "guess" => "You are on the DevOpsDays 2016 AMS, beerops" } }
	} else {
     		mutate { add_field => { "guess" => "Guessing seems impossible" } }
	}
}
900-output.conf

output {
  stdout { codec => rubydebug }
}
Now start the code with the command below en play with the input [carrot, pizza, beer or other]. Look at the guess field for the response.
/opt/logstash/bin/logstash -f /tmp/example
Are you ready for the first real job? In this section we will:
- Add the configuration for the 'syslog' input.
- Add the main configuration for setting the 'elasticsearch' output.
- We will create a
/etc/rsyslog.d/logstash.conffile to forward all syslog messages. - We will now test and see our results in Kibana.
- Finally we will create some basic filters to mask our security (facility 4 & 10) messages.
Start with creating the 'input' file /etc/logstash/conf.d/000-input.conf with the content below.
Note : That ports up to 1024 are exclusively for system/root usage.
#000-input.conf

input {
	syslog {
		port	   => 5014
		type  	   => "syslog"
		use_labels => true
		tags       => ["syslog","operatingsystem","logs"]
	}
}
Now create the main 'output' file /etc/logstash/conf.d/900-output.conf with the content below.
#900-output.conf

output {
	elasticsearch {
		manage_template => false
		hosts => ["localhost"]
		sniffing => true
	}
}
Now that we have a correct input & output defined we can test the configuration and start the service.
$ sudo service logstash configtest
Configuration OK
$ sudo service logstash start
Now that your logstash agent is running it is time to add the rsyslog forward configuration.
This can be easily done by adding a new file called /etc/rsyslog.d/logstash.conf.
#logstash.conf

# Forward all messages to logstash
*.* @@localhost:5014

# Save the file and restart the rsyslog service
$ sudo systemctl restart rsyslog
It is time to send your first test message. This can be done with a tool called logger.
Note : Please check your localtime before starting to send a message. Trick to synchronize the time easy is to restart chronyd
sudo systemctl restart chronyd
$ sudo systemctl restart chronyd
$ sudo logger -i -p auth.err Hello DevOpsDays
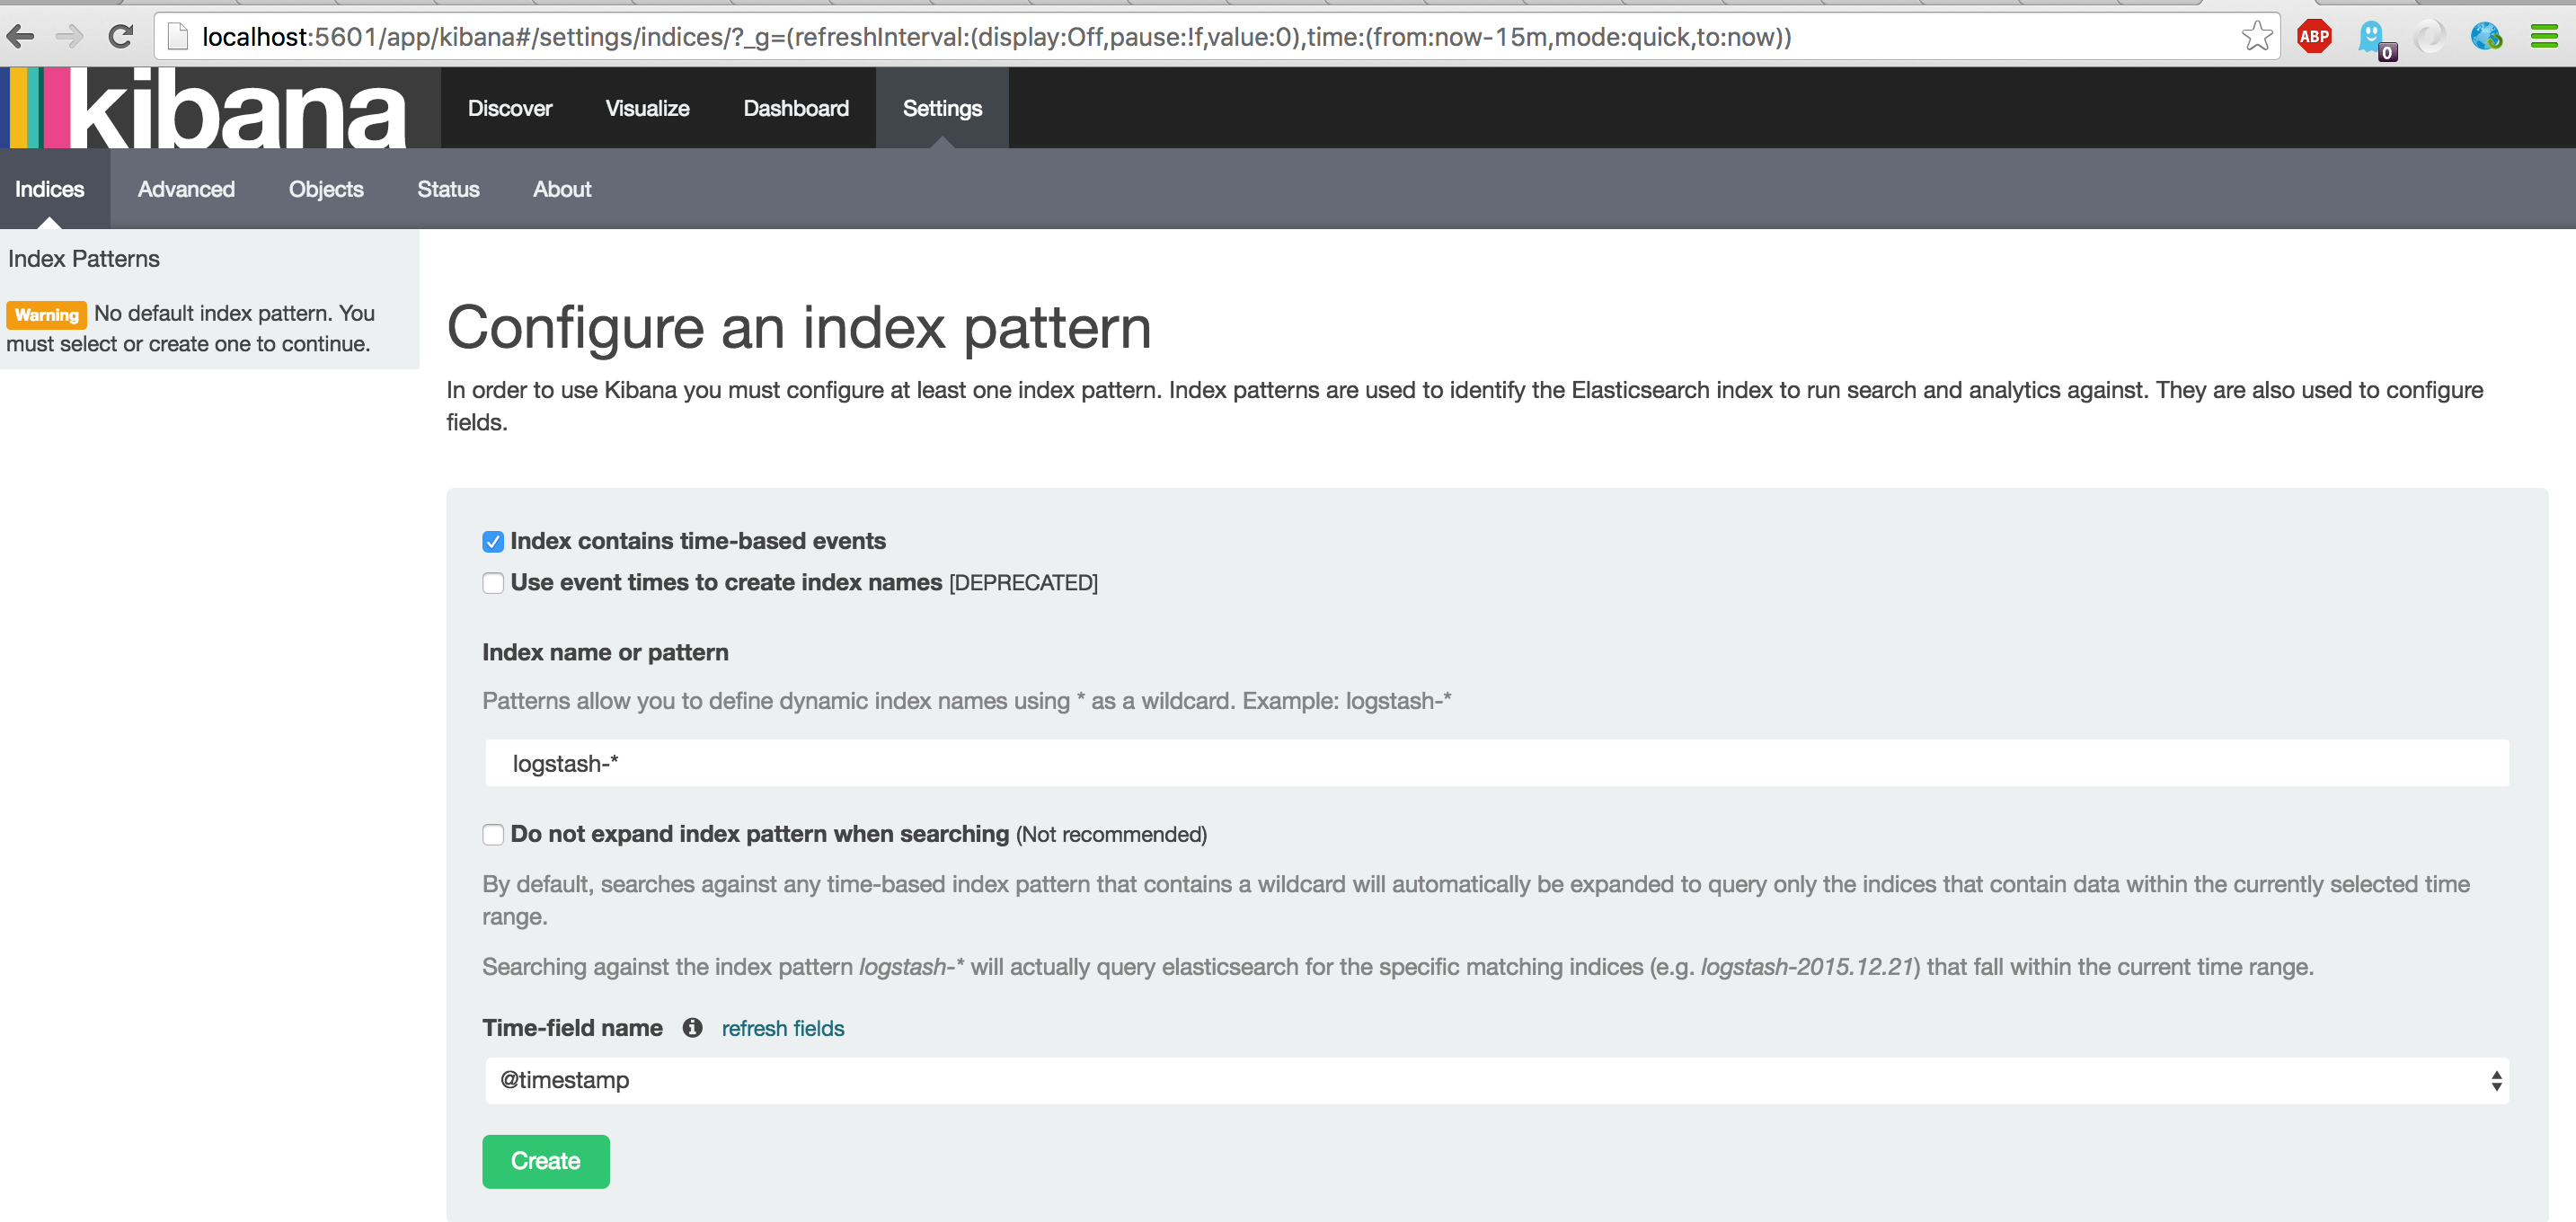
Open your local Kibana. Notice that you first have to configure your index pattern. Accept defaults and Click 'Create'
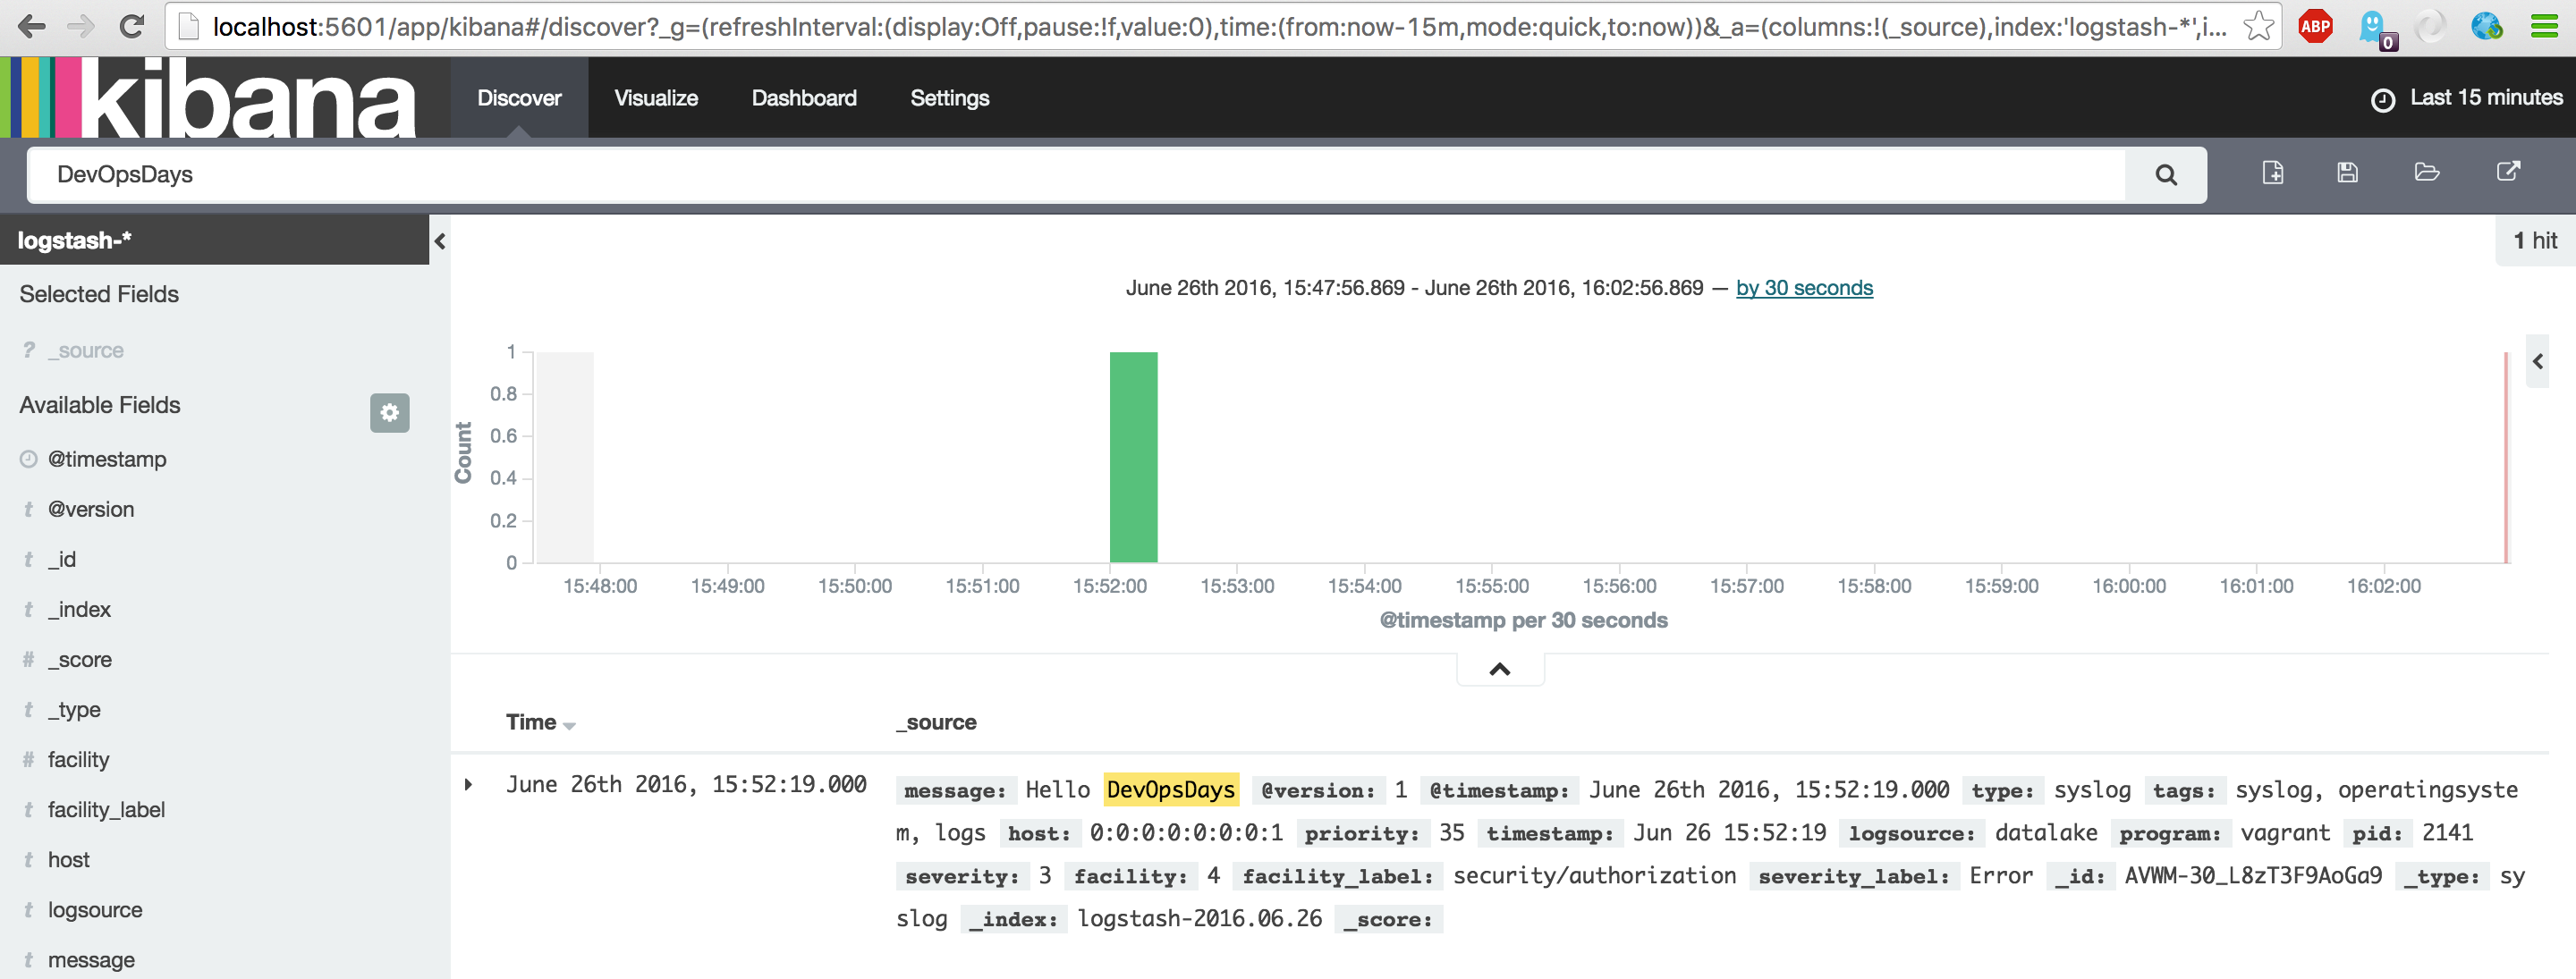
Now the index is shown. You can safely click 'Discover' to search for your event. See the result below.
As you might already notice. The facility type we used is exactly the one we have to mask. This masking can be easily done with an 'if condition' and use of the 'mutate' filter.
Below the example code for setting some helpfull information in large environments and finally masking the field.
Don't forget to first create the file /etc/logstash/conf.d/500-filter.conf.
# 500-filter.conf

filter {

	mutate {
                # Default configuration for mandatory fields for corporate ELK Solution
                # log_shipper => Should be the node hostname
                # log_version => Should be the version of the logstash shipper

                add_field => { "log_indexer" => "datalake"}
                add_field => { "log_version" => "logstash-2.3.3"}
        }
	if [type] == "syslog" {
		if [facility] == 4 or [facility] == 10 {
		 	mutate {
				replace => { "message" => "Due security policy this message is masked" }
				add_tag => [ "mask-applied" ]
		 	}
		}
	}
}
Don't forget to configtest and restart logstash. Send five additional messages.
$ sudo service logstash configtest
$ sudo service logstash restart
$ sudo logger -i -p auth.err Hello DevOpsDays
$ sudo logger -i -p auth.err Hello DevOpsDays
$ sudo logger -i -p authpriv.err Hello DevOpsDays
$ sudo logger -i -p authpriv.err Hello DevOpsDays
$ sudo logger -i Hello DevOpsDays # Normal user facility
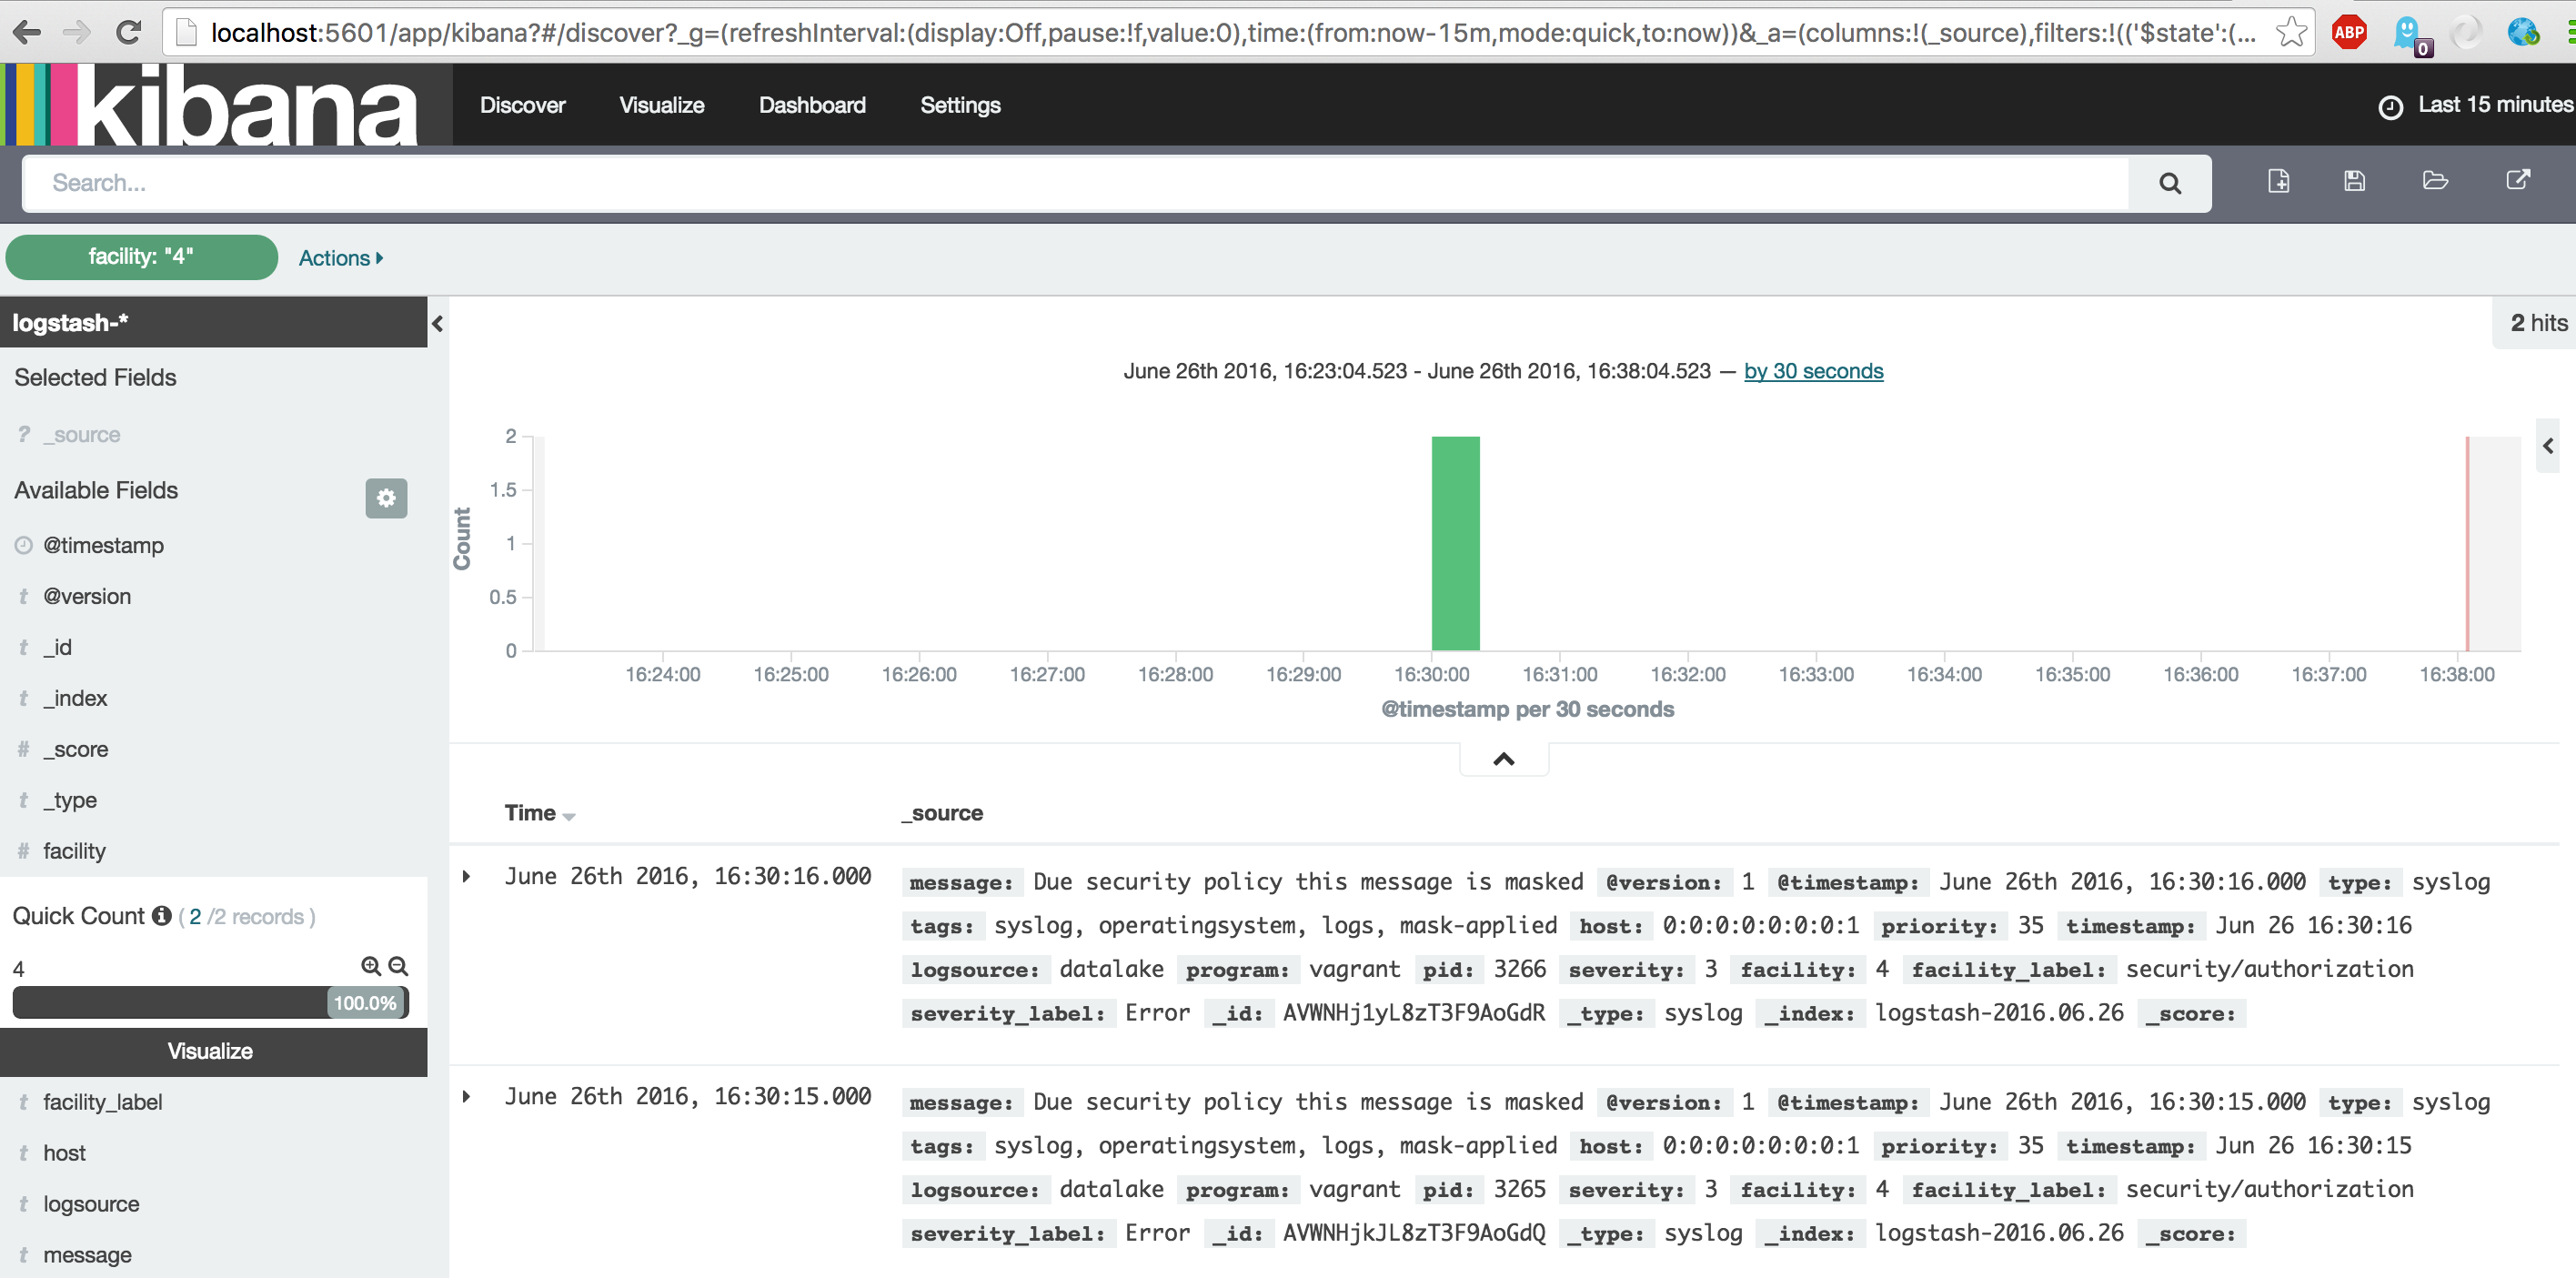
Now again use Discover to see the latest events. Now click on the facility field on the left and zoom in on the value '4' messages. Repeat this for the value '10'.
Now that we successfully connected the 'syslog' messages we can start connecting the Middleware logs. In this section we will setup the parsing of Middleware logs with the 'file' input.
- Add the configuration for the 'file' input.
- Setup and validate our required Grok filters.
- Integrate the new 'filter' configuration.
- We will now test and see our results in Kibana.
To keep the configuration simple we will extend our current /etc/logstash/conf.d/000-input.conf configuration.
Note : We aware that this 'file' input must be included in the existing
input { }statement.
file {
   		path => "/var/log/tomcat/catalina.log"
    		type => "tomcat"
    		codec => multiline {
          		pattern => "^\s"
         		what => "previous"
    		}
		tags => ["tomcat","middleware","logs"]
}
Note : Did you see the multiline codec defined ? This tells logstash how to handle multiline exceptions. In our case all lines that start with a belong to the previous line. This total sum of lines will then be the message which will be stored in the data lake.
Now that we have our log file configured, we can setup the correct parsing. This parsing is usually done with the famous 'grok' filter. Below a sample message in the catalina.log
24-Feb-2016 14:58:21.447 SEVERE [localhost-startStop-2] org.apache.catalina.loader.WebappClassLoader.checkThreadLocalMapForLeaks The web application has shutdown with leaks
As we can see the format is like:
# Format
<timestamp> <severity> <module> <class> <message>

# Fields to parse out.

<tmp_mday-tmp_month-tmp_year tmp_time> <appl_severity> <appl_module> <appl_class> <appl_message>

#Expected pattern

%{MONTHDAY:tmp_mday}-%{MONTH:tmp_month}-%{YEAR:tmp_year} %{TIME:tmp_time} %{LOGLEVEL:appl_loglevel} \[%{DATA:appl_module}\] %{DATA:appl_class} %{GREEDYDATA:appl_message}
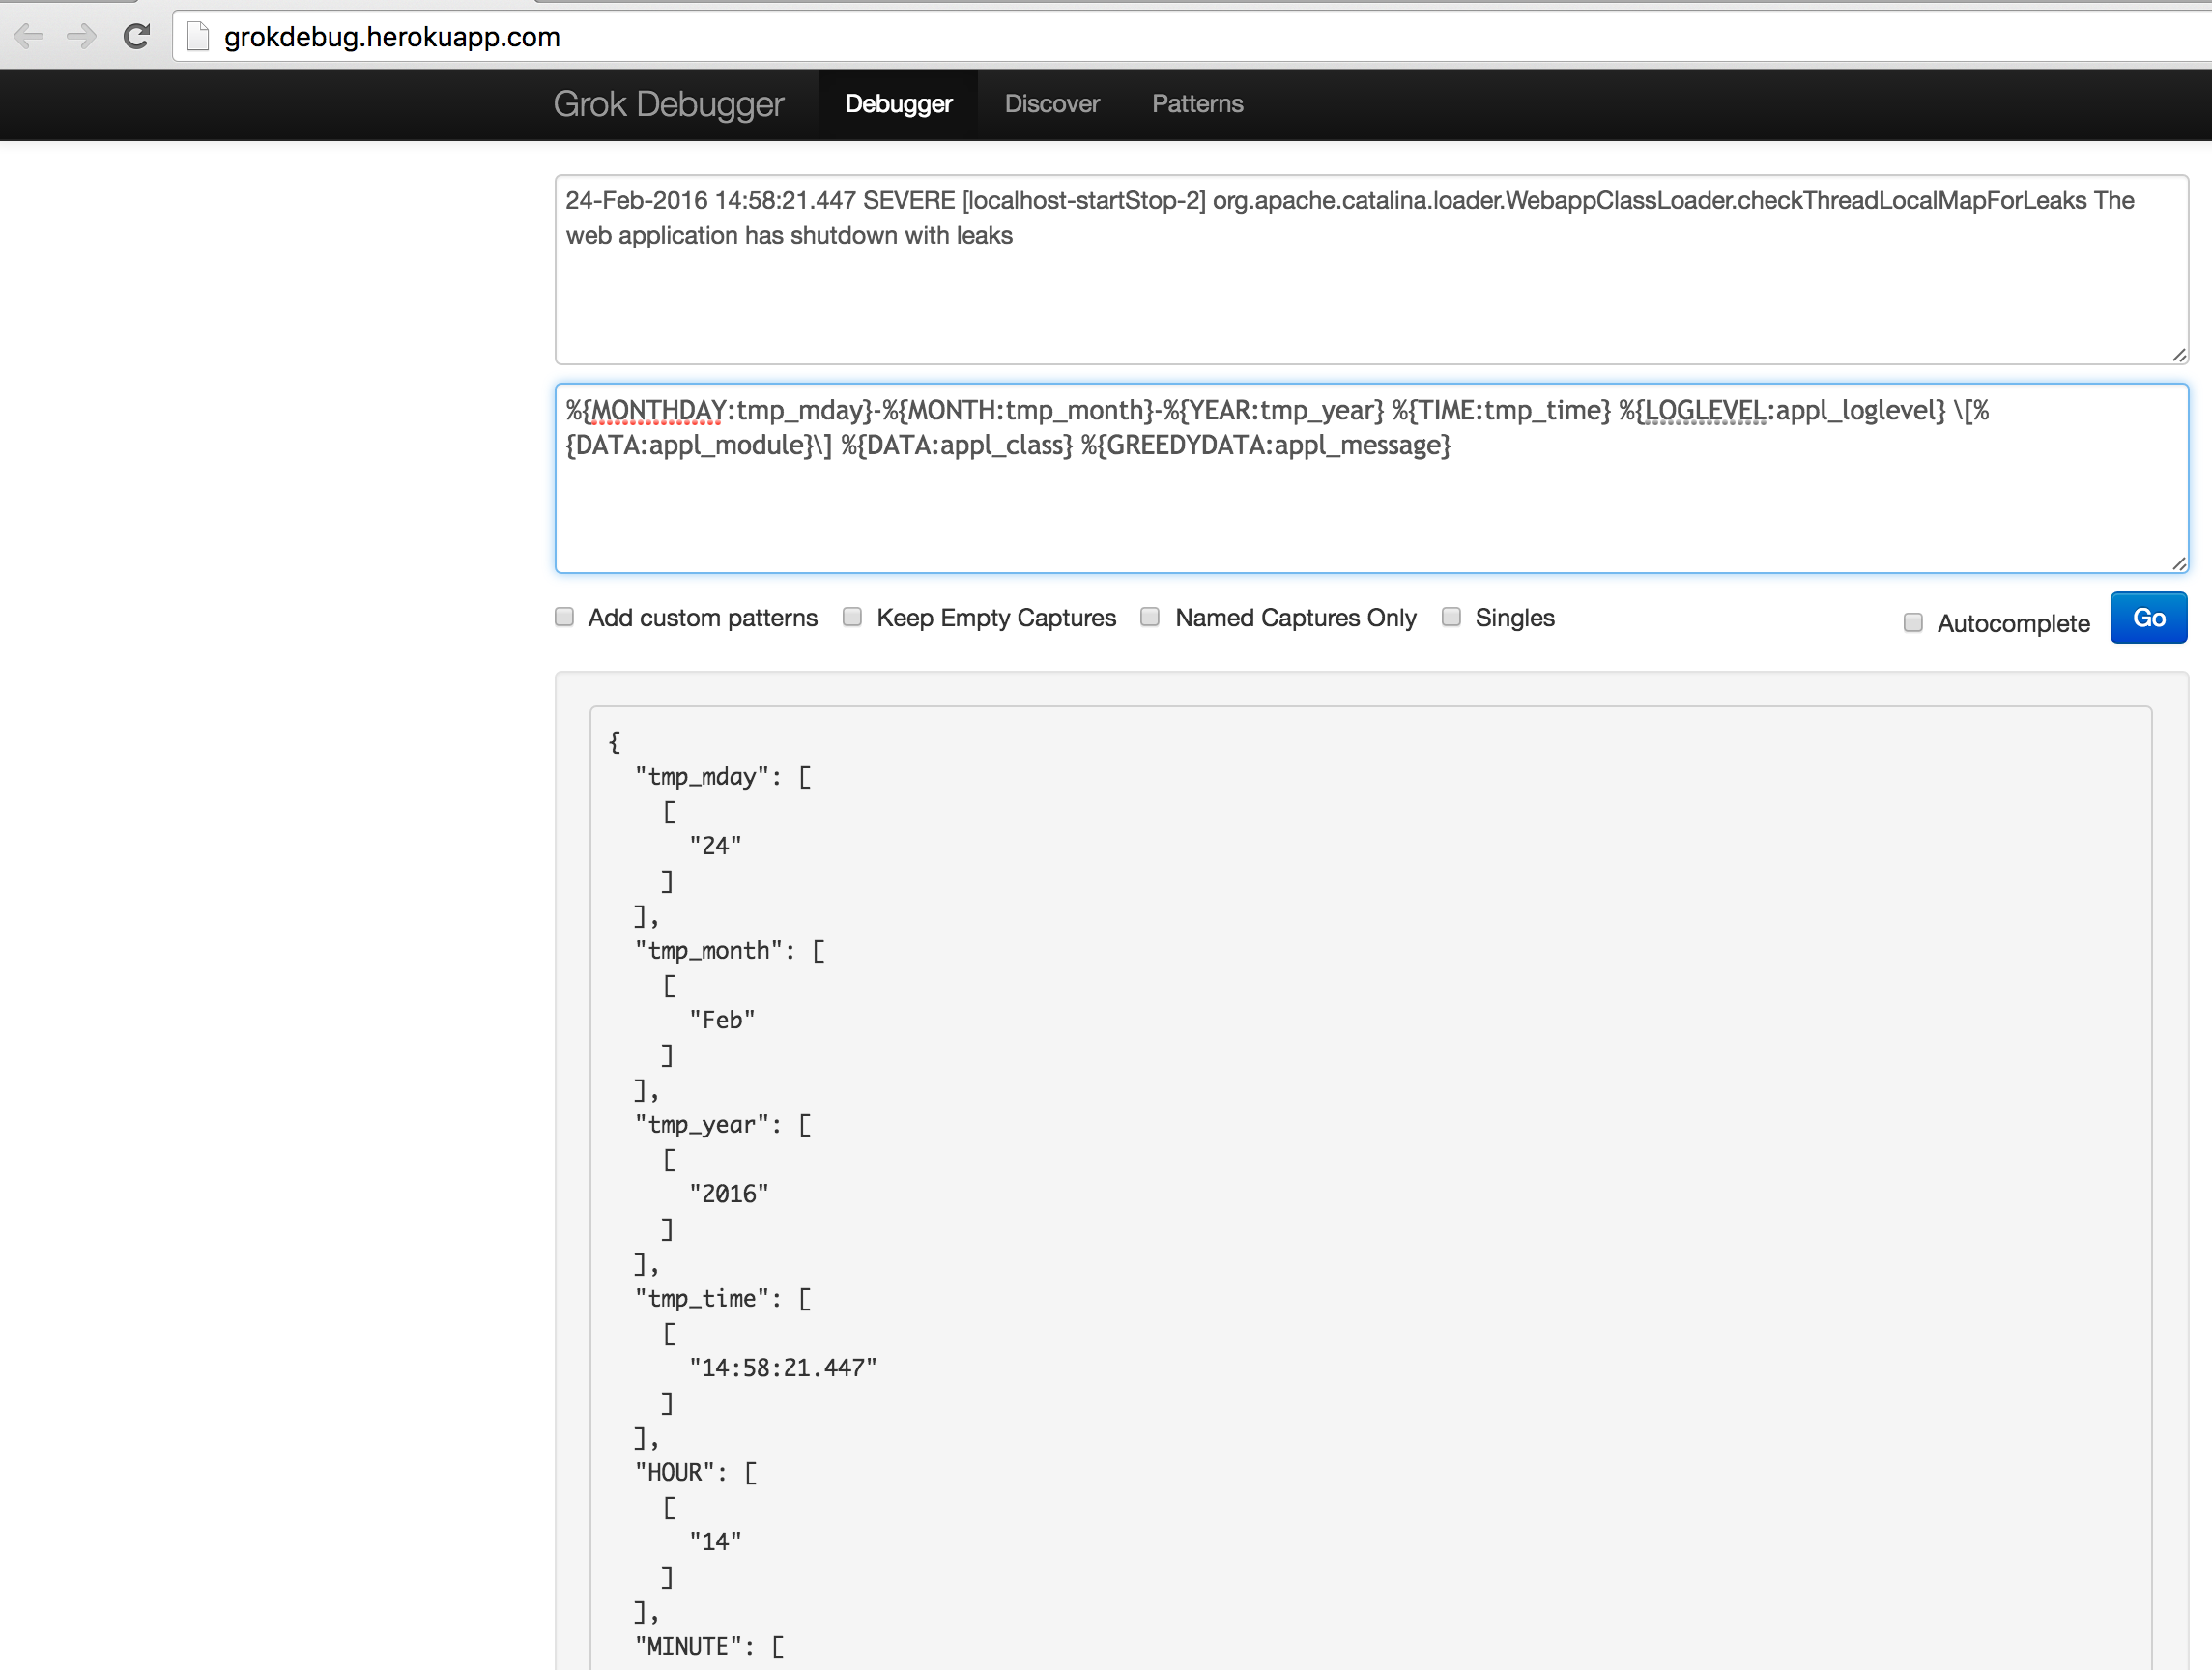
Now that we know the format, fields to parse out and expected pattern we can use the grok-debugger to split up the fields.Start a HTML5 compatible browser and follow the screenshot below. Copy the sample message to the Input field and the expected pattern to the Pattern Field.
Now that we found the grok pattern to match we can extend our /etc/logstash/conf.d/500-filter.conf configuration.
Don't forget that we have to rebuild our timestamp (by using the tmp_* fields) and set our log entry timestamp as event timestamp. As you see this is done with the 'date' filter.
if [type] == "tomcat" {
                grok {
                        match => [ "message", "%{MONTHDAY:tmp_mday}-%{MONTH:tmp_month}-%{YEAR:tmp_year} %{TIME:tmp_time} %{LOGLEVEL:appl_loglevel} \[%{DATA:appl_module}\] %{DATA:appl_class} %{GREEDYDATA:appl_message}" ]
                }

                mutate {
                        add_field => { "timestamp" => "%{tmp_mday}-%{tmp_month}-%{tmp_year} %{tmp_time}" }
                        remove_field => [ "tmp_mday","tmp_month","tmp_year","tmp_time" ]
                }

                date {
                        match => [ "timestamp", "dd-MMM-yyyy HH:mm:ss.SSS" ]
                        remove_field => [ "timestamp" ]
                }
}
Don't forget to configtest and restart logstash to activate the new configuration.
$ sudo service logstash configtest
$ sudo service logstash restart
As list item we can test our configuration. For this a generator is available, which is in the DOD-AMS-Workshop package.
$ sudo su -
# cd /usr/local/src/DOD-AMS-Workshop/generator
# ./log-generator.py &
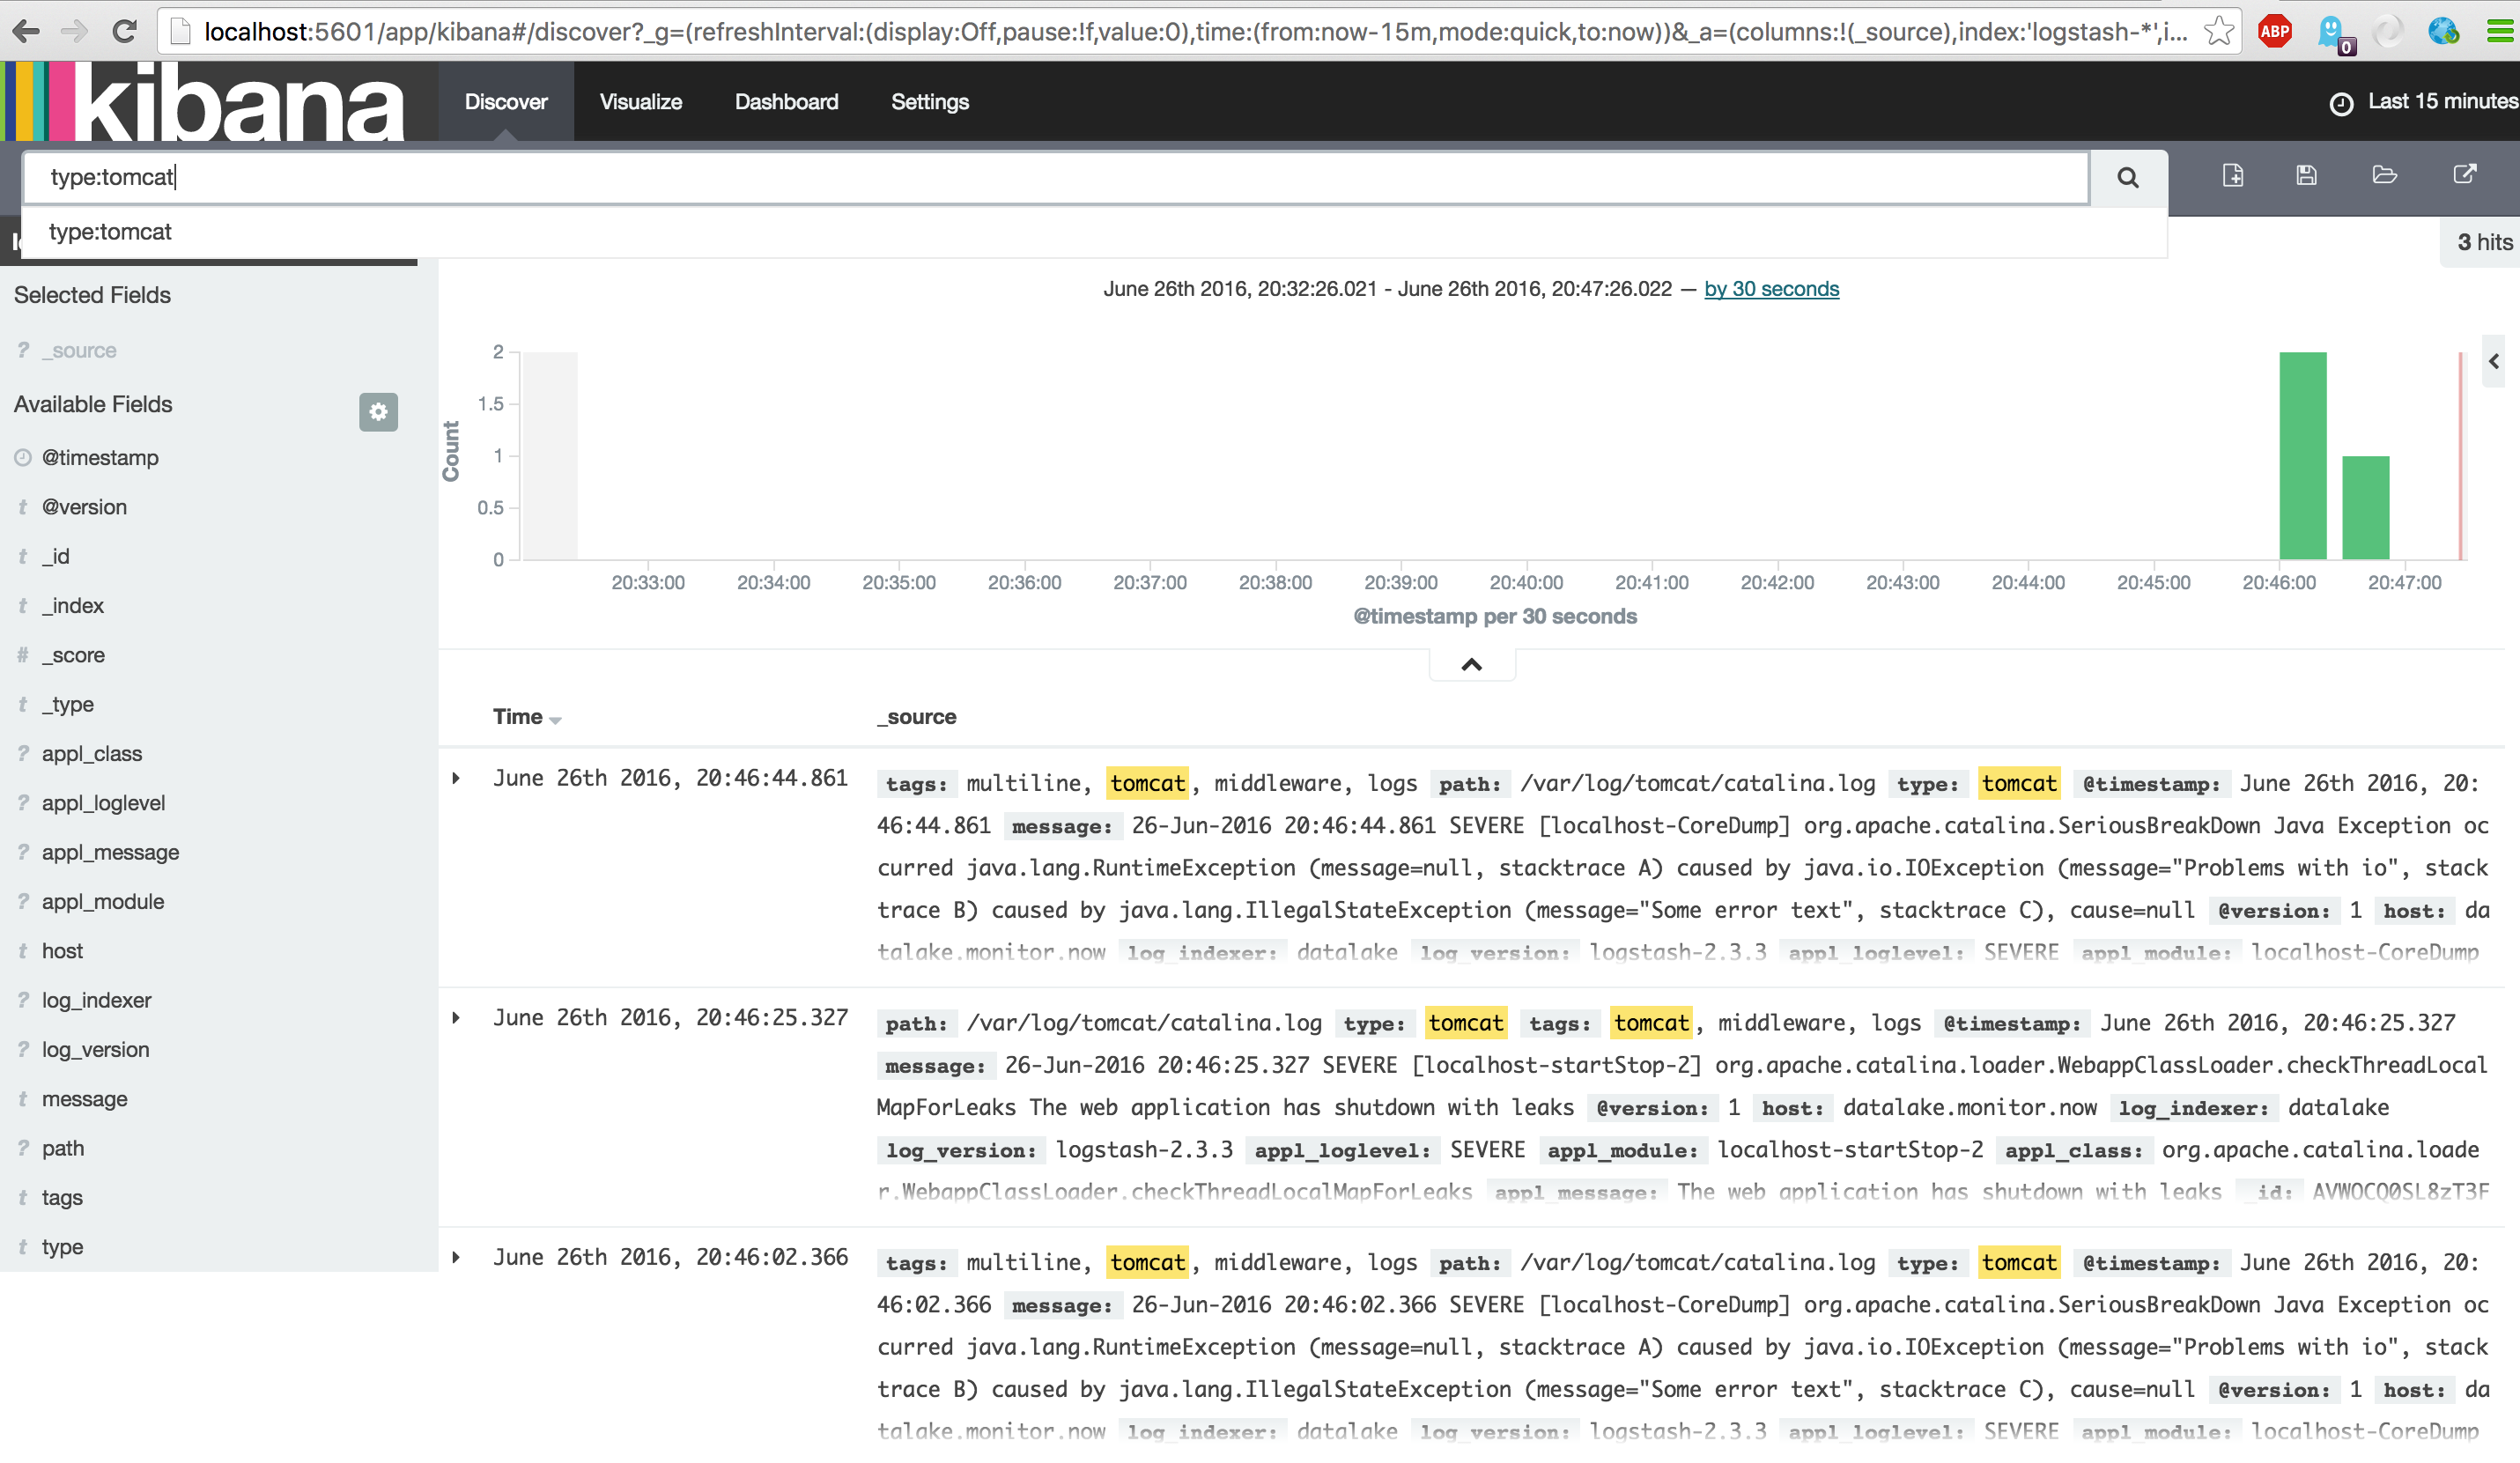
After starting the log-generator open the Kibana Discover dasboard again and search for 'type:tomcat' to show all tomcat type events. Also notice the tomcat events, which have a multiline tag.
Now that we have created a configuration for Tomcat Middleware and had some hands-on experience parsing the grok filter, creating the application log monitoring is quite easy.
For the performance log we need to make changes to the data type,before sending the metrics to the data lake.
We have to complete the following tasks to complete this section.
- Add the configuration for the 'file' input.
- Setup, validate and integrate our required filters for application logging.
- Transform the performance logging with 'filter' configuration to metric data.
- Create a solution to handle all unmatched messages and drop all 'NAWModule' messages.
- Add some additional lines to the code to add the 'application context', which can be 'functional' or 'technical'
- We will now test and see our results in Kibana.
Again we will use the 'file' input. Extend our current /etc/logstash/conf.d/000-input.conf configuration.
# 000-input.conf

file {
	path => "/var/log/tomcat/BankIT-application.log"
    	type => "application"
    	tags => ["bankit", "application","logs"]
}

file {
	path => "/var/log/tomcat/BankIT-performance.log"
    	type => "performance"
    	tags => ["bankit","application","metrics"]
}
Now we have to define the pattern for the grok matching. As seen in the section above you can easily do this online with grok-debugger. Open the browser and build the pattern yourself. Please use the same field names as in the section above.
Below an sample message in the BankIT-application.log
26-Jun-2016 20:57:54.728 SEVERE [NAWModule] com.openbank.bankit.NAWModule.Update John Doe record updated with Flevostraat 100, Purmerend
Now that you have discovered the pattern you can implement the code below. please extend our current /etc/logstash/conf.d/500-filter.conf configuration. As you see below we also set the correct timestamp again.
if [type] == "application" {
                grok {
                        match => [ "message", "%{MONTHDAY:tmp_mday}-%{MONTH:tmp_month}-%{YEAR:tmp_year} %{TIME:tmp_time} %{LOGLEVEL:appl_loglevel} \[%{DATA:appl_module}\] %{DATA:appl_class} %{GREEDYDATA:appl_message}" ]
                }

                mutate {
                        add_field => { "timestamp" => "%{tmp_mday}-%{tmp_month}-%{tmp_year} %{tmp_time}" }
                        remove_field => [ "tmp_mday","tmp_month","tmp_year","tmp_time" ]
                }

                date {
                        match => [ "timestamp", "dd-MMM-yyyy HH:mm:ss.SSS" ]
                        remove_field => [ "timestamp" ]
                }
	}
Since most of the information that we gathered is logging, it doesn't mean that we can save some metrics to enrich a dashboard. To do this correctly we have to make sure we commit our field value in the correct format, which is an Integer. Default a field is parsed out with grok or kv as String, but with strings we can't create a histogram over time.
Note : Also be aware that the first entry of an attribute in elasticsearch will define the datatype.
For implementing the performance log parsing we need another filter type, called 'kv' or key-value pairs.
Below an sample message in the BankIT-performance.log
key=2016-06-26 21:40:39.999|value=79|module=claims
As you can see the key/value pairs are delimited by and underscore '|' and will be parsed out by the 'kv' filter. As mentioned above all values are parsed out as String, so we have to convert our string to an integer. Finally we will do the timestamp trick again.
Below the code that you can use to extend the /etc/logstash/conf.d/500-filter.conf configuration.
if [type] == "performance" {
	kv {
		field_split => "|"
		add_field => { "performance_timestamp" => "%{key}" }
		add_field => { "performance_value" => "%{value}" }
		add_field => { "appl_module" => "%{module}" }
	}

	mutate {
		convert => [ "performance_value", "integer" ]
		remove_field => [ "key" ]
		remove_field => [ "value" ]
		remove_field => [ "module" ]
		add_field => { "timestamp" => "%{performance_timestamp}" }
  	}

	date {
		 match => [ "timestamp", "yyyy-MM-dd HH:mm:ss.SSS" ]
		 remove_field => [ "timestamp" ]
	}

}
Now that we added all grok matches (we know), what will happen with all unmatched messages ? These messages will pass by, but will not be parsed, neither enriched. But for handling these messages (with _grokparsefailure tag) we can implement a small solution to replace the message or add an additional header.
In this scenario we will add an additional header in front of the original message using the 'mutate' filter. Always put this at the end of your filter definitions, which in our case is /etc/logstash/conf.d/500-filter.conf file.
if "_grokparsefailure" in [tags] {

	mutate {
		replace => { "message" => "PATTERN MISSING: %{message}" }
  	}
}
Last thing we have to do is to fullfil is the requirement to enrich our application messages with the application context:Functional or Technical and drop privacy-sensitive messages. This are the lines that you really don't want to receive in your data lake.
For this we received the following mapping.
- Messages from module:HouseKeepingModule must have the Technical application context.
- Messages from module:RegistrationModule must have the Functional application context.
- Messages from module:NAWModule have Security context and must be dropped.
First we create two if statements on the 'appl_module' value (HouseKeepingModule or RegistrationModule) to add an addtional field 'appl_context' with either Technical or Functional.
Be aware that you put this in the /etc/logstash/conf.d/500-filter.conf within the type:application (if) statement and after the grok filter (otherwise the 'appl_module' field is not yet available).
# grok filter

if [appl_module] =~ /HouseKeepingModule/ {
             mutate {
                    add_field => { "appl_context" => "Technical" }
             }
}

if [appl_module] =~ /RegistrationModule/ {
             mutate {
                    add_field => { "appl_context" => "Functional" }
             }
}

# mutate filter
To drop specific received messages you can use the special filter called 'drop'. In this scenario dropping application messages that contain 'NAWModule' will do the trick.
Our advice is to add this on top of your filter configuration (/etc/logstash/conf.d/500-filter.conf) to minimize processing of unwanted events.
if [type] == "application" and [message] =~ /NAWModule/ {
        drop { }
}
Don't forget to configtest and restart logstash to activate the new configuration.
$ sudo service logstash configtest
$ sudo service logstash restart
As last item we can test our configuration. For this a generator is available, which is in the DOD-AMS-Workshop package. probably this is already running in the background, which you can check by ps -ef | grep log-generator.
$ sudo su -
# cd /usr/local/src/DOD-AMS-Workshop/generator
# ./log-generator.py &
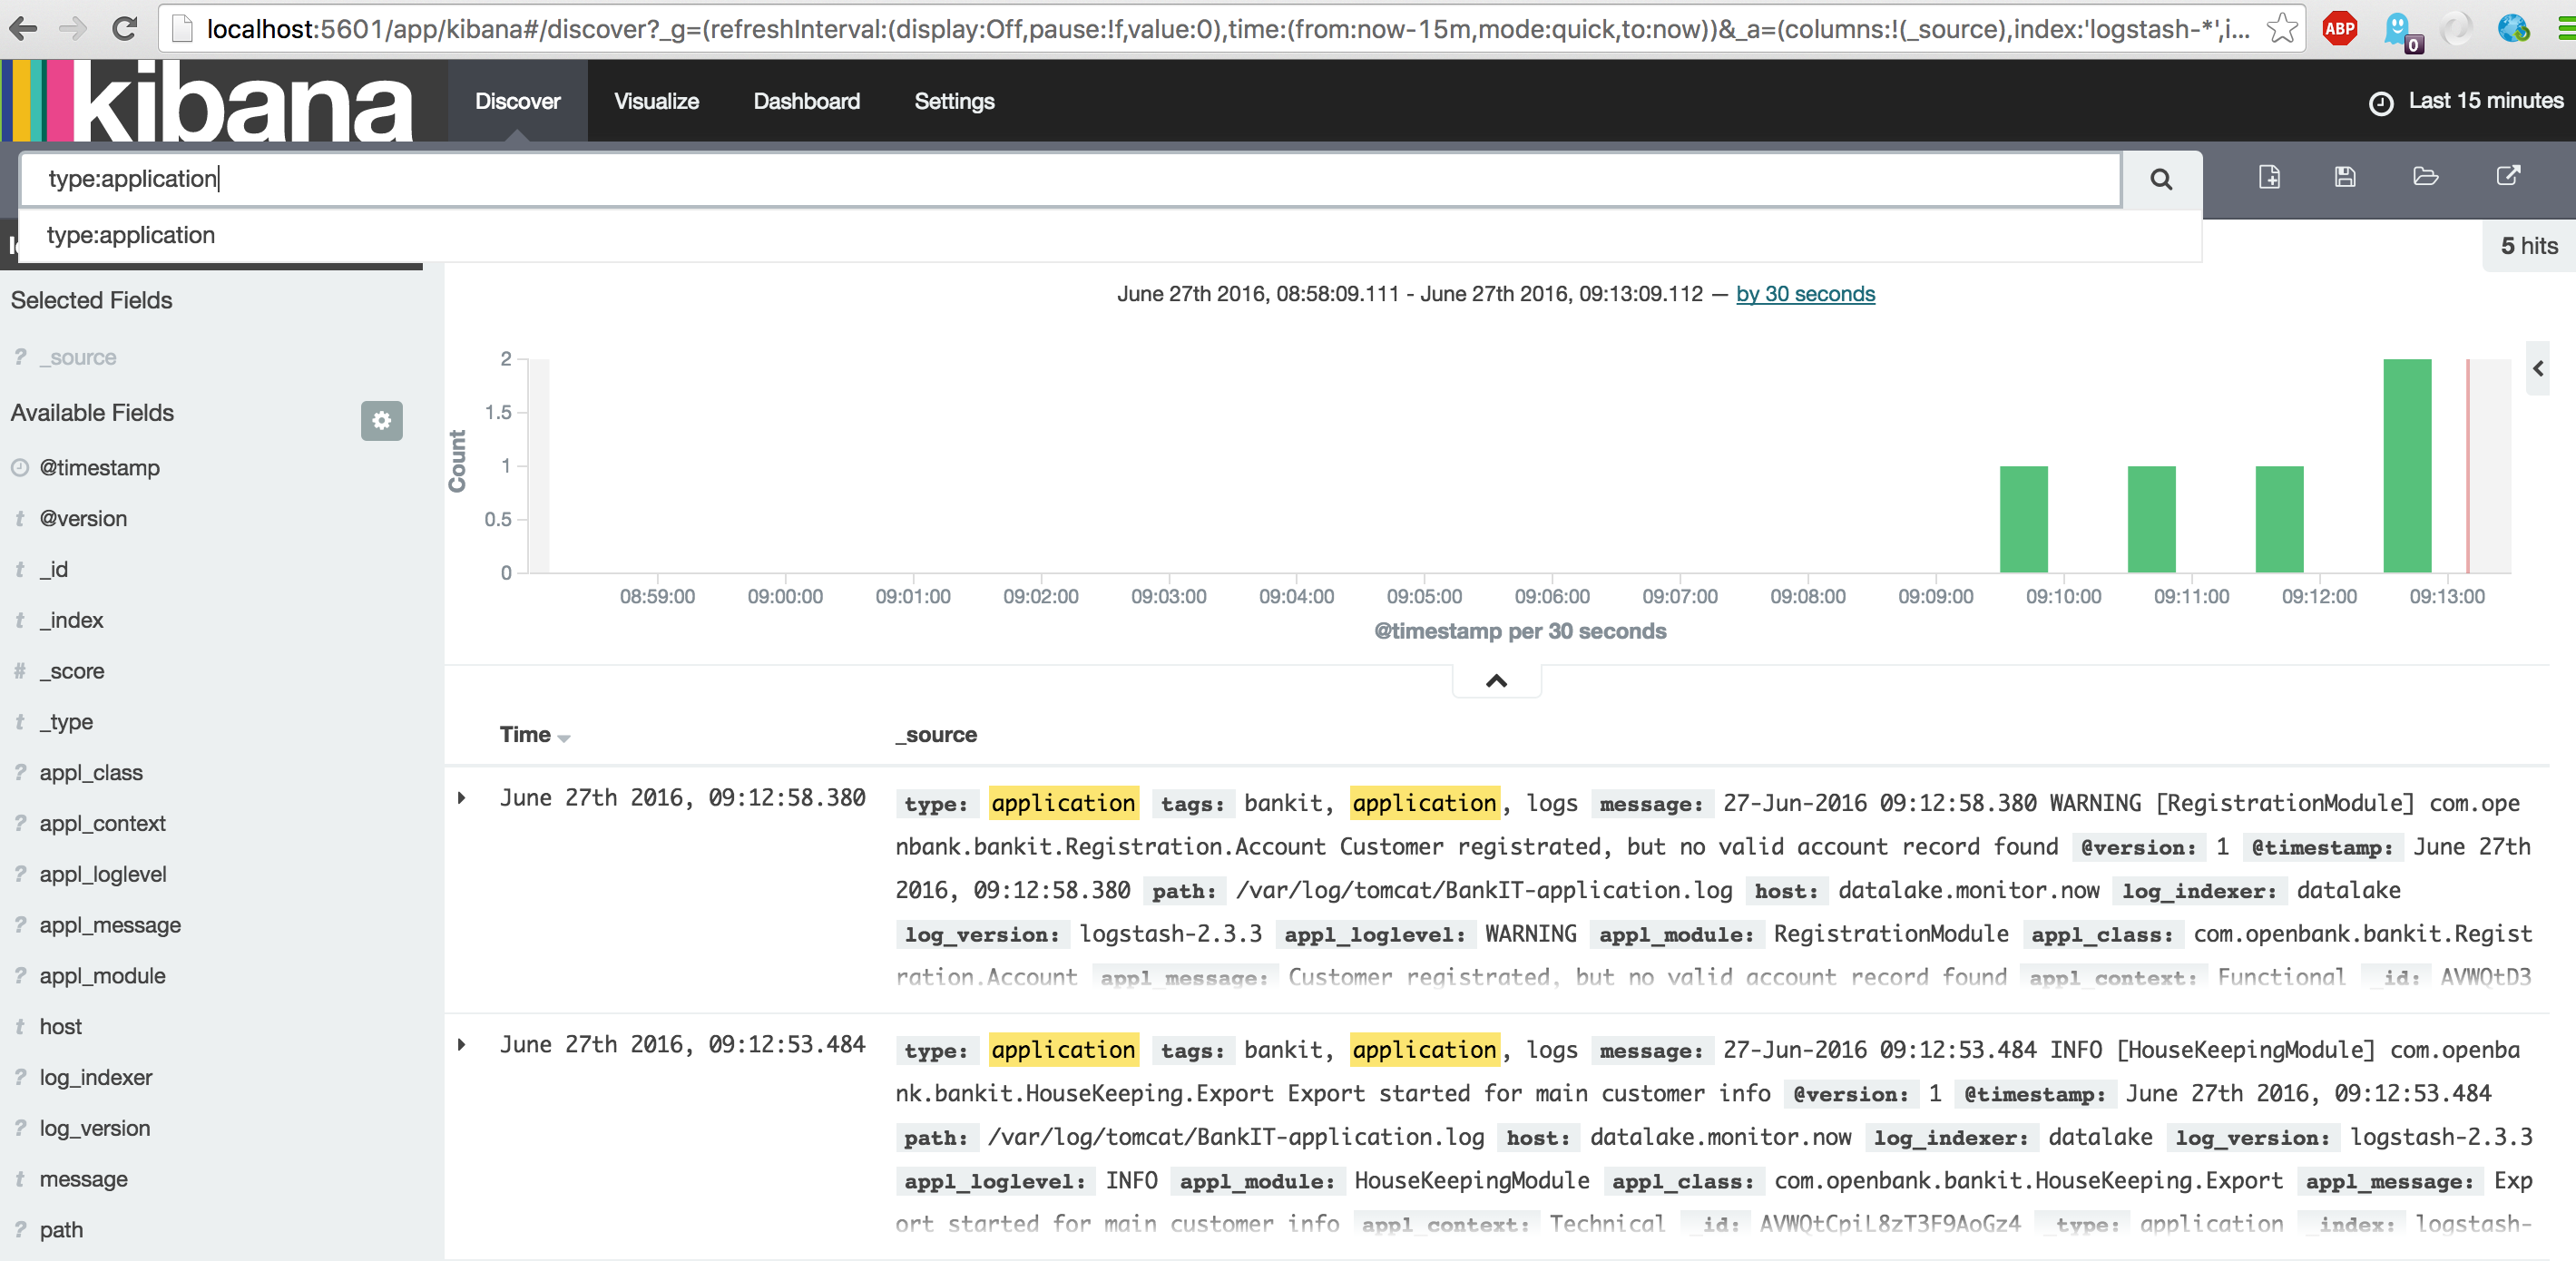
After starting the log-generator open the Kibana Discover dasboard again and search for 'type:application' to show all application type events.
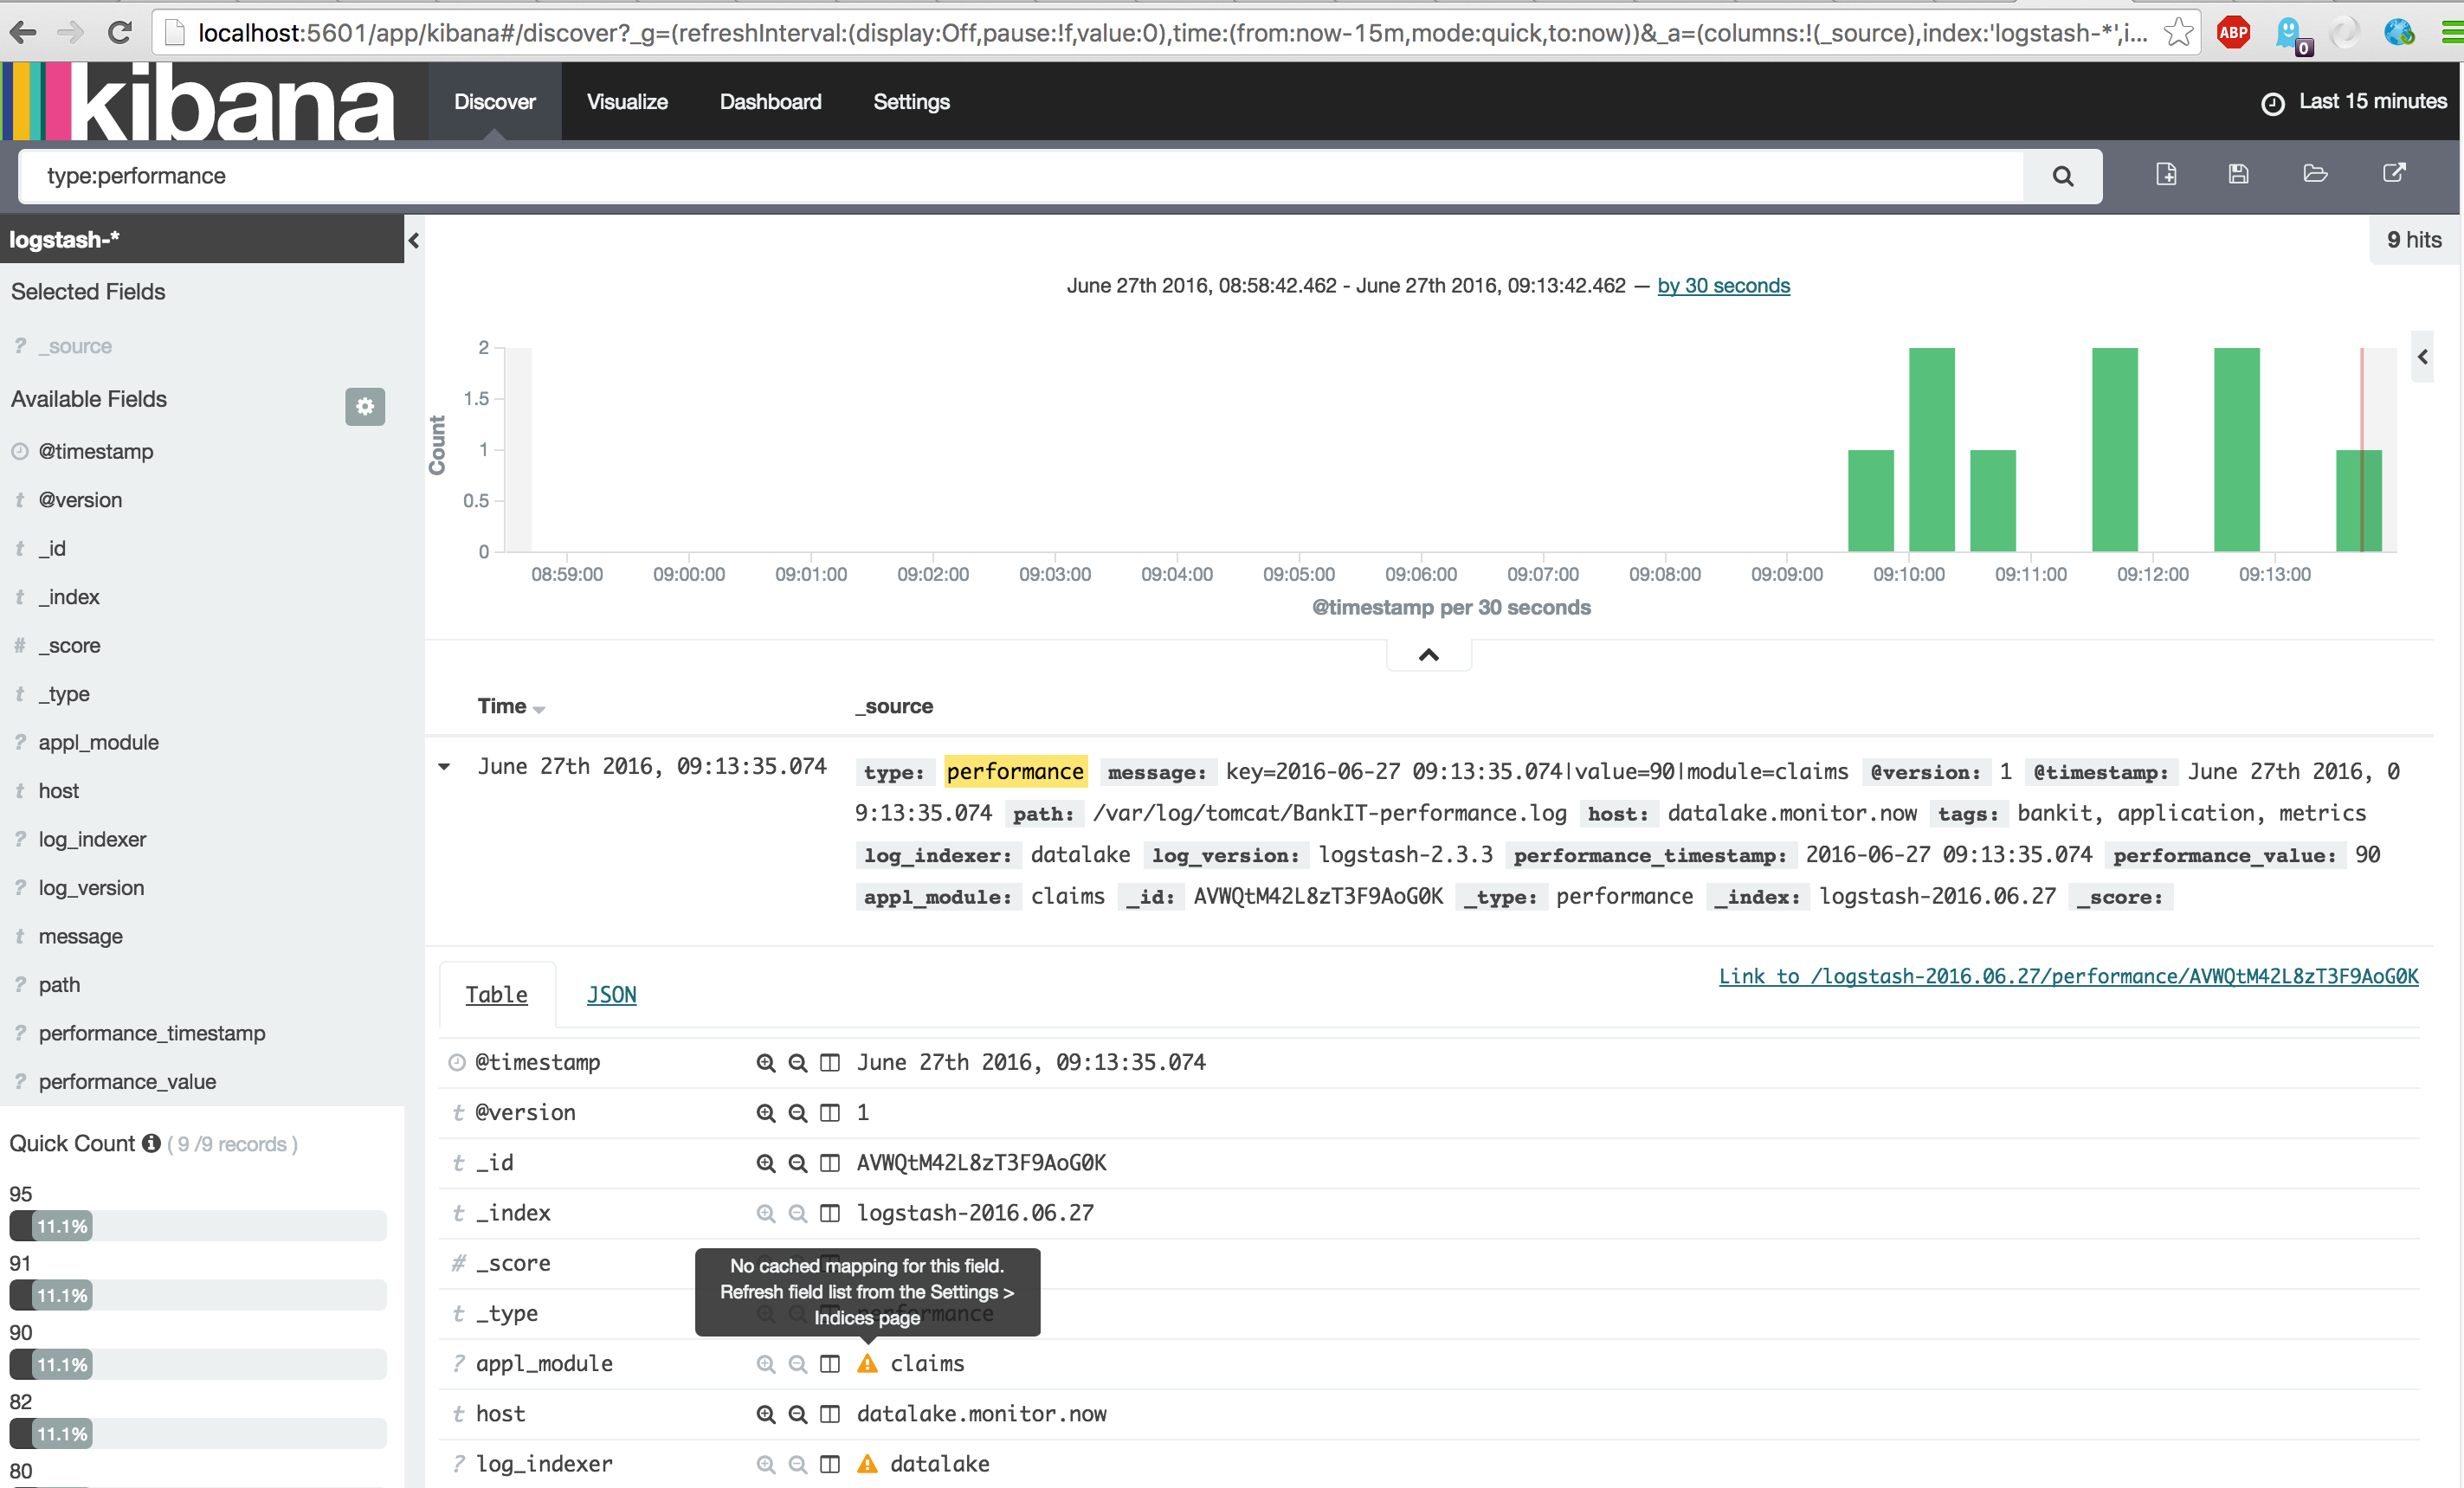
Repeat the same for the 'type:performance' events.
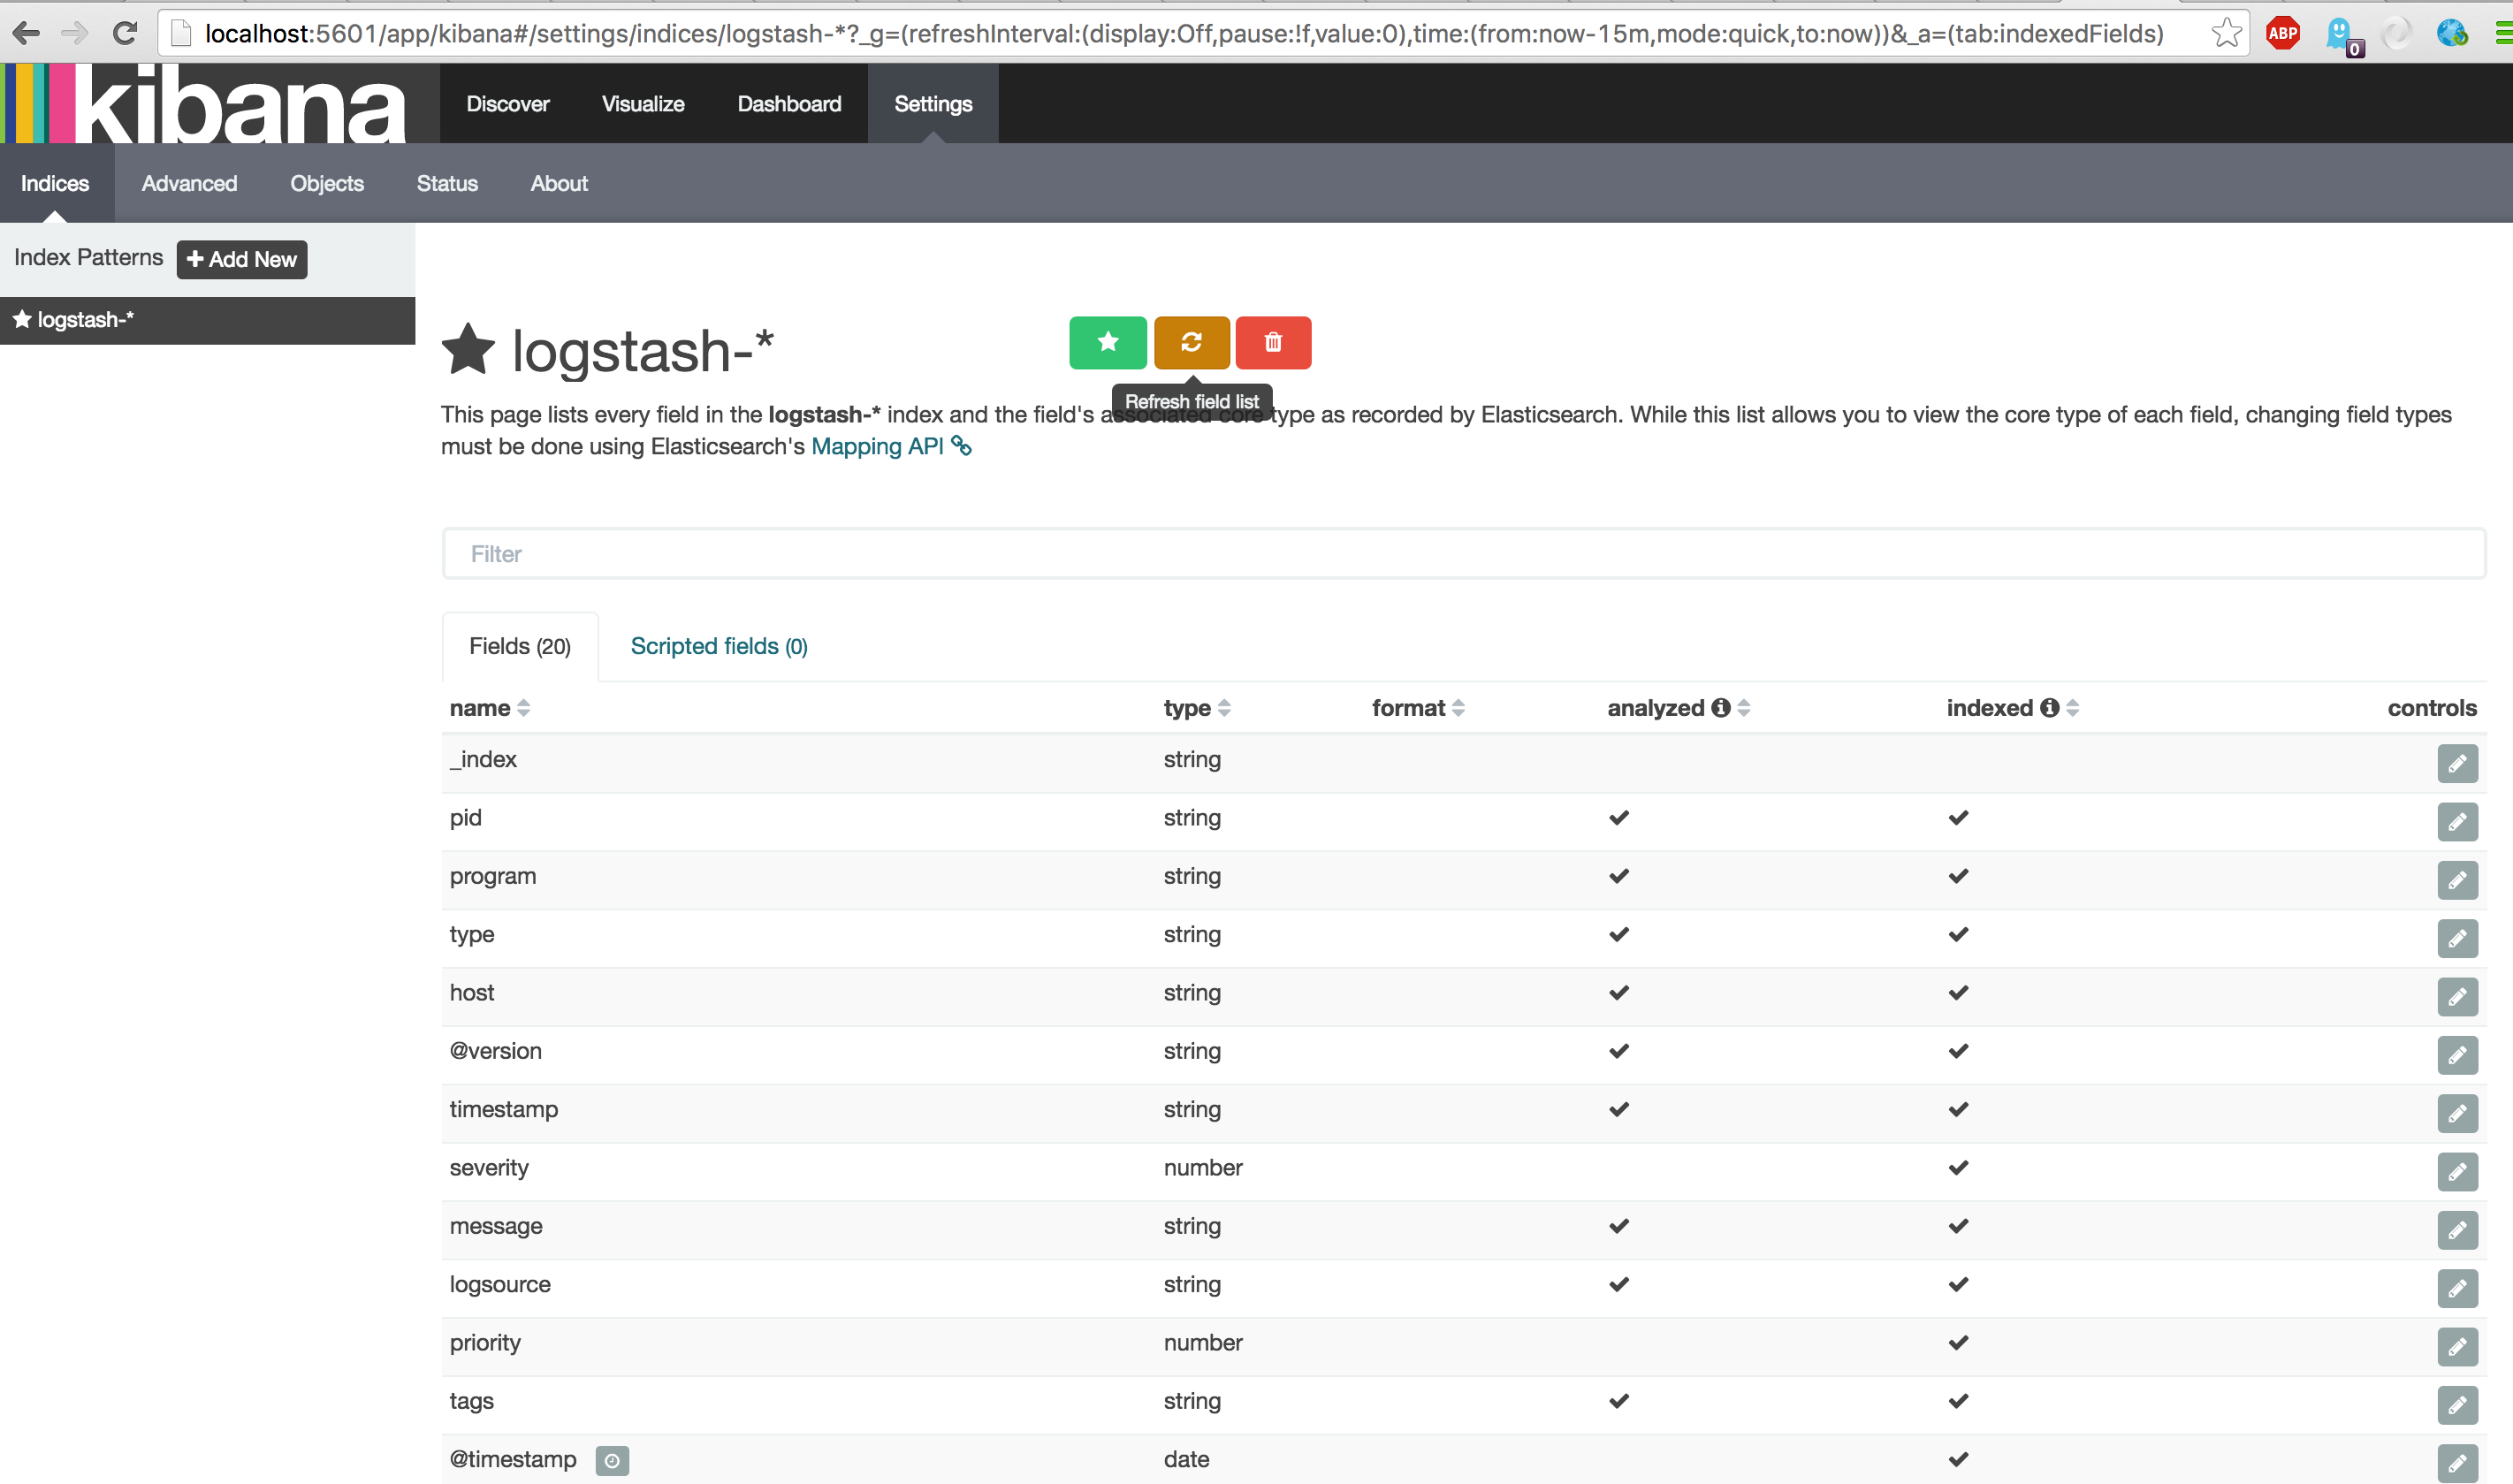
Now notice all the yellow exclamation marks. This means that some fields are not default mapped in your index scheme. To save your new scheme, go to Settings -> Indices, click on the Index pattern 'logstash-*' and click the orange refresh button.
After the refresh lookup the 'performance_value' field and notice that it is default mapped to a type of Number (i.e. Integer).
You can now edit the field definition and set the formatting mandatory to number, which will force the formatting displayed in Kibana. Now open a performance type event and look at the field, this now will show the # which is indicating a number value instead of a string t.
Now that we have finished the logstash part we can create the actual dashboard. With Kibana 4 many new visualizations are introduced to explore your data. But also the concepts and approach to configure dashboards is really changed. Below we will walk through the Three Configuration stages to make a simple dashboard.
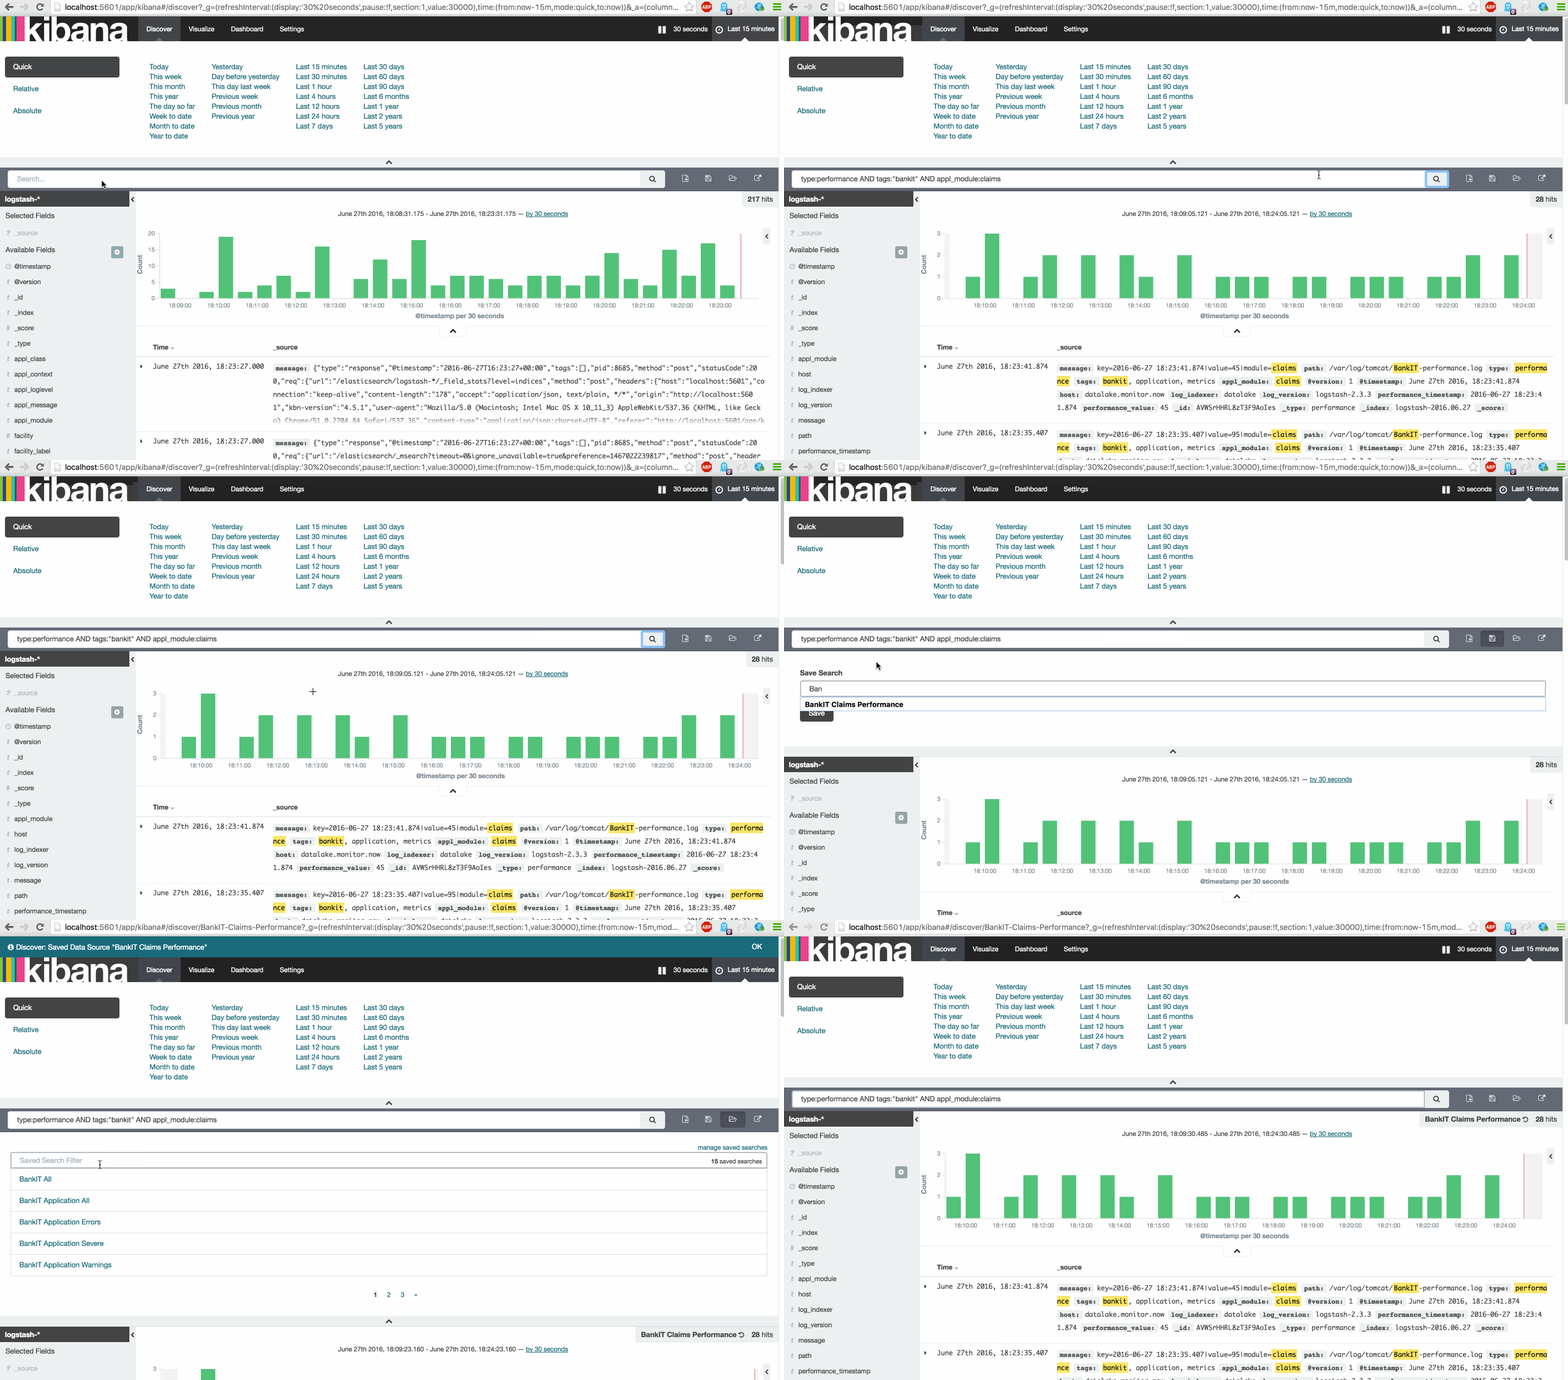
The first phase is Discover. In this phase you will explore the data and create your data sets (aka Searches), which you will use later in the dashboards or visualizations.
Data querying is easy. It is based on the Lucene® engine and accepts full text search. In the previous sections you already did some specific field/value queries, like 'type:application'. You can also combine the queries with AND/OR statements.
To create the awesome dashboard we need 14 saved Searches.
First look at this instruction video and then create the following Searches.
| Search Name | Search Query |
|---|---|
| BankIT All | tags:"bankit" |
| BankIT Claims Performance | type:performance AND tags:"bankit" AND appl_module:claims |
| BankIT Application Severe | type:application AND tags:"bankit" AND severe |
| BankIT Application Error | type:application AND tags:"bankit" AND error |
| BankIT Application Warning | type:application AND tags:"bankit" AND warning |
| BankIT Application All | type:application AND tags:"bankit" |
| BankIT Functional Messages | type:application AND tags:"bankit" AND appl_context:Functional |
| BankIT Technical Messages | type:application AND tags:"bankit" AND appl_context:Technical |
| BankIT Grok Parser Failed | type:application AND tags:"bankit" AND _grokparsefailure |
| BankIT Middleware Events | type:tomcat AND tags:"middleware" |
| BankIT Middleware Warnings | type:tomcat AND tags:"middleware" AND warning |
| BankIT Middleware Errors | type:tomcat AND tags:"middleware" AND error |
| BankIT Middleware Exceptions | type:tomcat AND tags:"middleware" AND Exception |
| BankIT Operating System Events | type:syslog AND tags:"operatingsystem" |
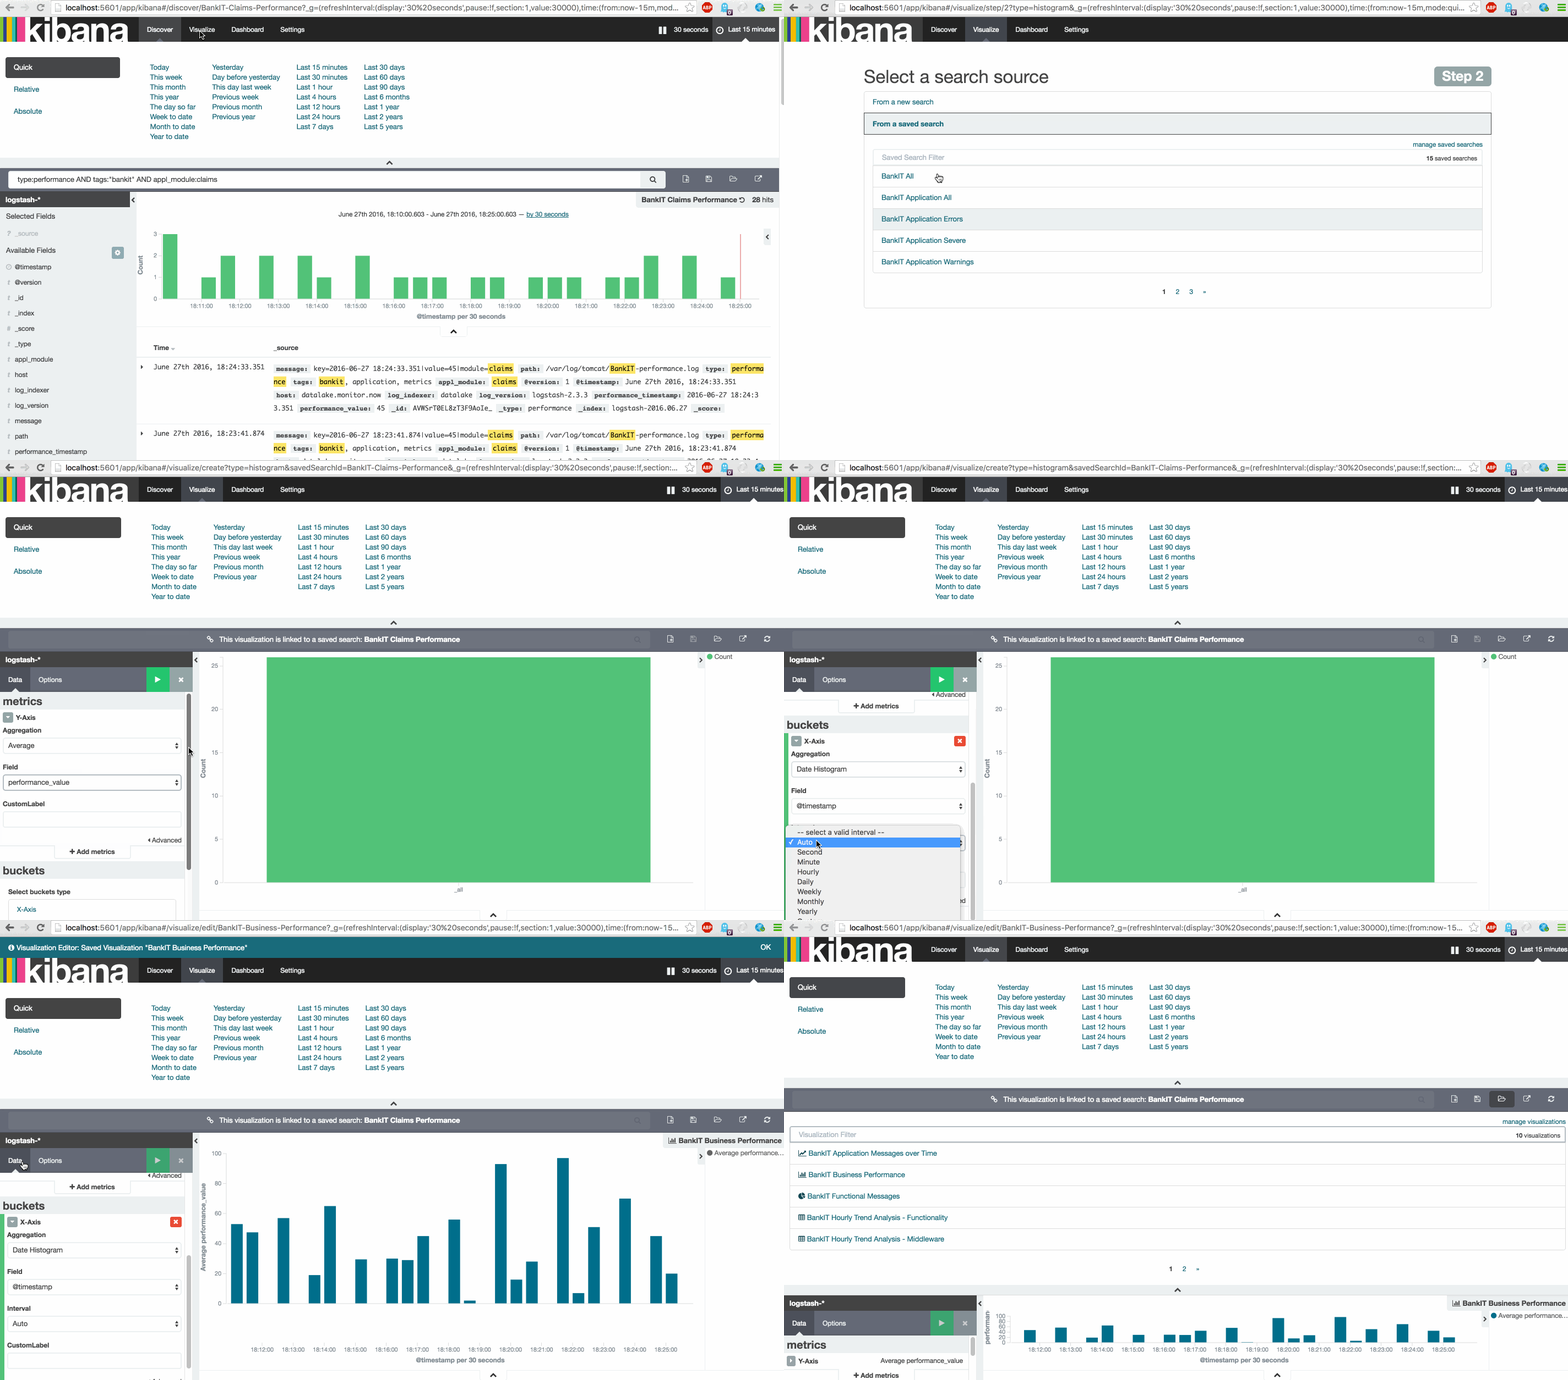
Now that all the datasets are discovered and saved as Searches we can start creating the visualization layer by choosing the correct Visualizations and their underlying Metric(s) and Bucket(s). The easiest way to learn the various Visualizations with their metric and bucket possibilities is just to experiment with them by using a familiar dataset. It’s not hard, but needs some attention.
Now we are two steps behind the dashboard.
First look at this instruction video and then create the following Visualizations.
| Viz Name | Viz Type | Search | Metric | Bucket(s) |
|---|---|---|---|---|
| BankIT Application messages over time | Line chart | BankIT Application all | Aggregation => Count | X-Axis => Aggregation => Date Histogram,Split Lines => Sub Aggregation => 3 Filters (*, severe, warning) |
| BankIT Business Performance | Vertical bar chart | BankIT Claims Performance | Average => performance_value | X-Axis => Aggregation => Date Histogram |
| BankIT Functional Messages | Pie Chart | BankIT Functional messsages | Aggregation => Count | Split Slices => Aggregation => Terms:appl_loglevel,Split Slices => Sub Aggregation => Terms:appl_class |
| BankIT Technical Messages | Pie Chart | BankIT Technical messsages | Aggregation => Count | Split Slices Aggregation => Terms:appl_loglevel,Split Slices => Sub Aggregation => Terms:appl_class |
| BankIT Unknown Pattern | Vertical bar Chart | BankIT Grok Parser Failed | Aggregation => Count | X-Axis => Aggregation => Data Histogram |
| BankIT Middleware Messages over Time | Area Chart | BankIT Middleware Events | Aggregation => Count | X-Axis => Aggregation => Date Histogram,Split Area => Sub Aggregation => 3 Filters(*, exception, error) |
| BankIT Hourly Trend Analysis - Functionality | Data Table | BankIT All | Aggregation => Count | Split Rows => Aggregation => Date Range => Ranges = today last hour (now - 1h till now) + yesterday last hour(now-25h till now-24h), Split Rows => sub aggregation => 2 Filters("type=application AND appl_context=Functional", "type=performance") |
| BankIT Hourly Trend Analysis - Middleware | Data Table | BankIT Middleware Events | Aggregation => Count | Split Rows => Aggregation => Date Range => Ranges = today last hour (now - 1h till now) + yesterday last hour(now-25h till now-24h), Split Rows => sub aggregation => 3 Filters("exception", "warning","severe") |
| BankIT Total Exceptions | Metric | BankIT Middleware Exceptions | Aggregation => Count | n.a. |
| BankIT OperatingSystem Facilities shown by Severity over time | Vertical bar chart | BankIT Operating System Events | Aggregation => Count | X-Axis => Aggregation => Date Histogram,Split Bars => Sub Aggregation => Terms => facility_label, Split Chart => Sub Aggregation => terms => severity_label |
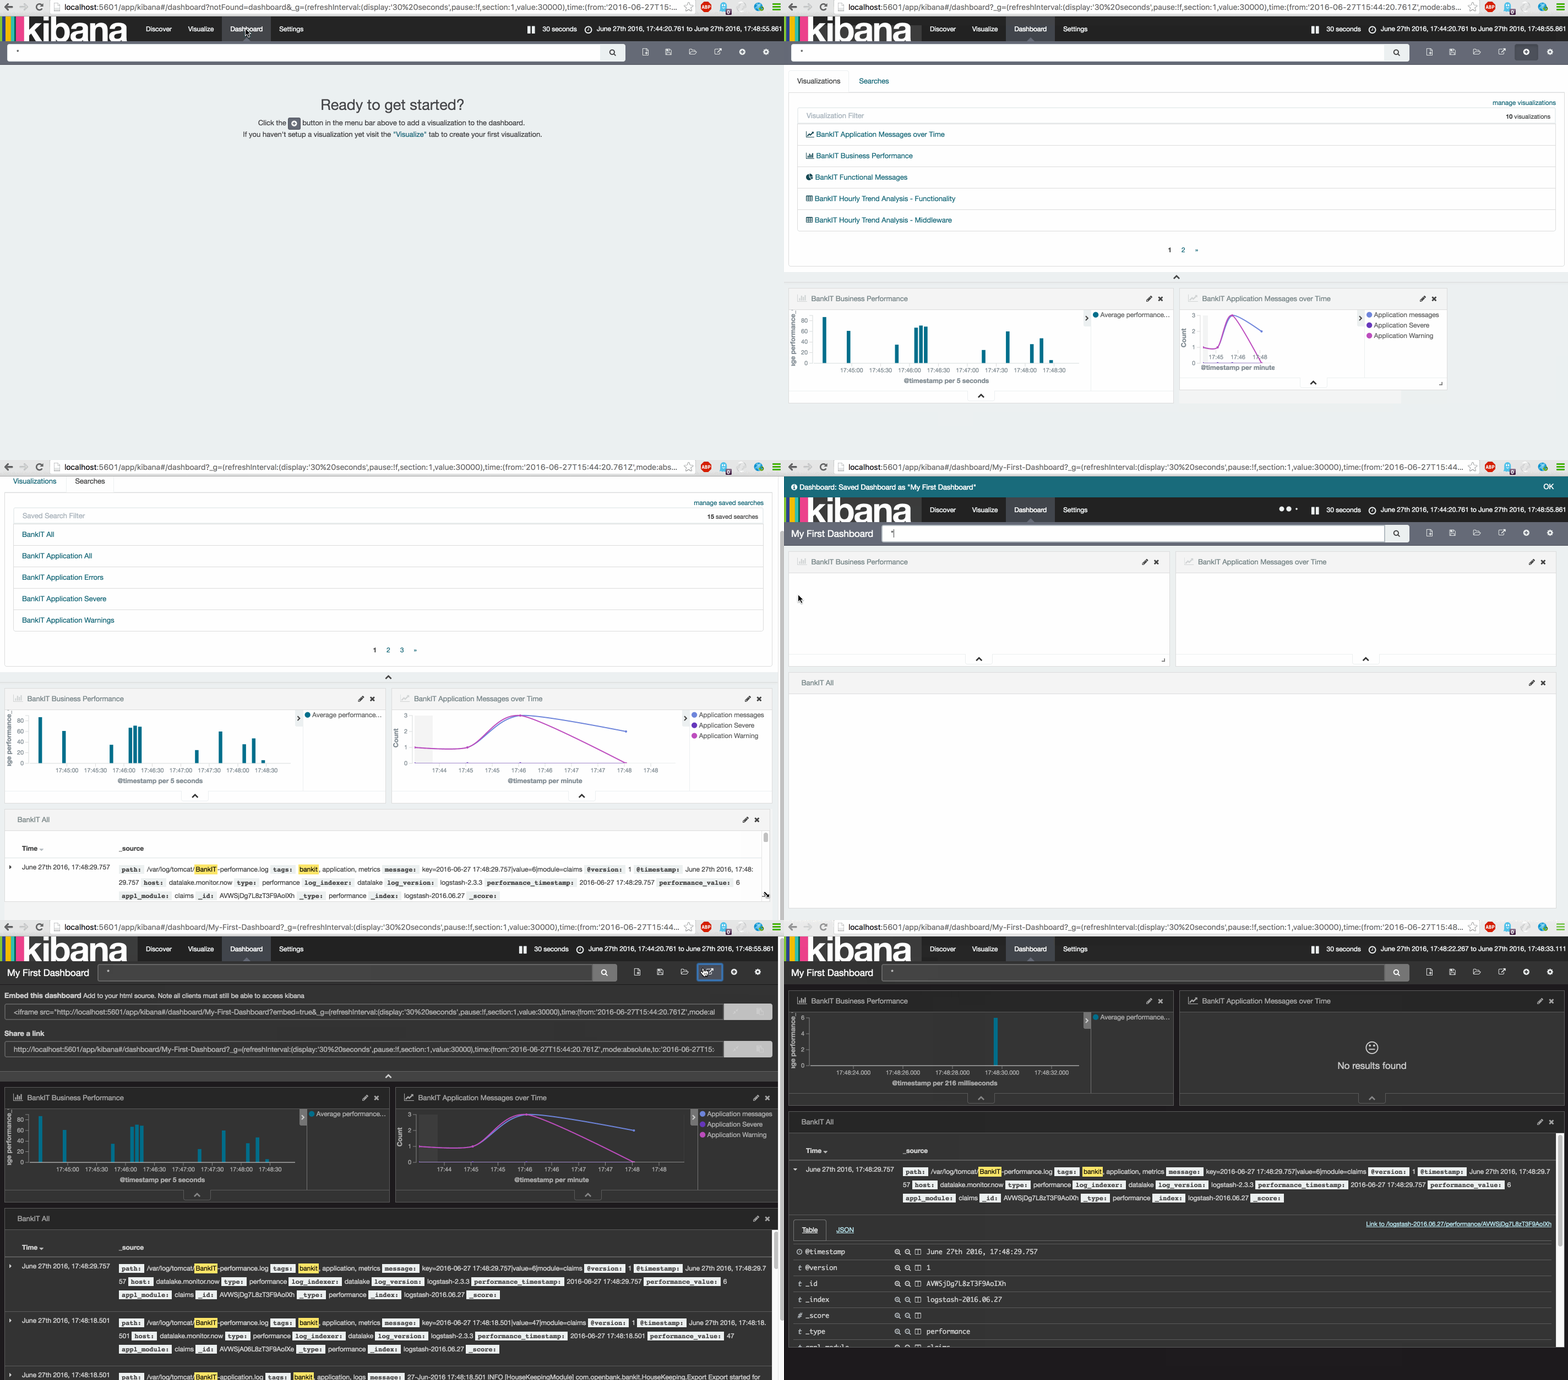
Finally the last step to create the actual dashboard, which is the simplest task. Just select all your 'Visualizations' and/or 'Searches' and save it.
First look at this instruction video and then create a dashboard.
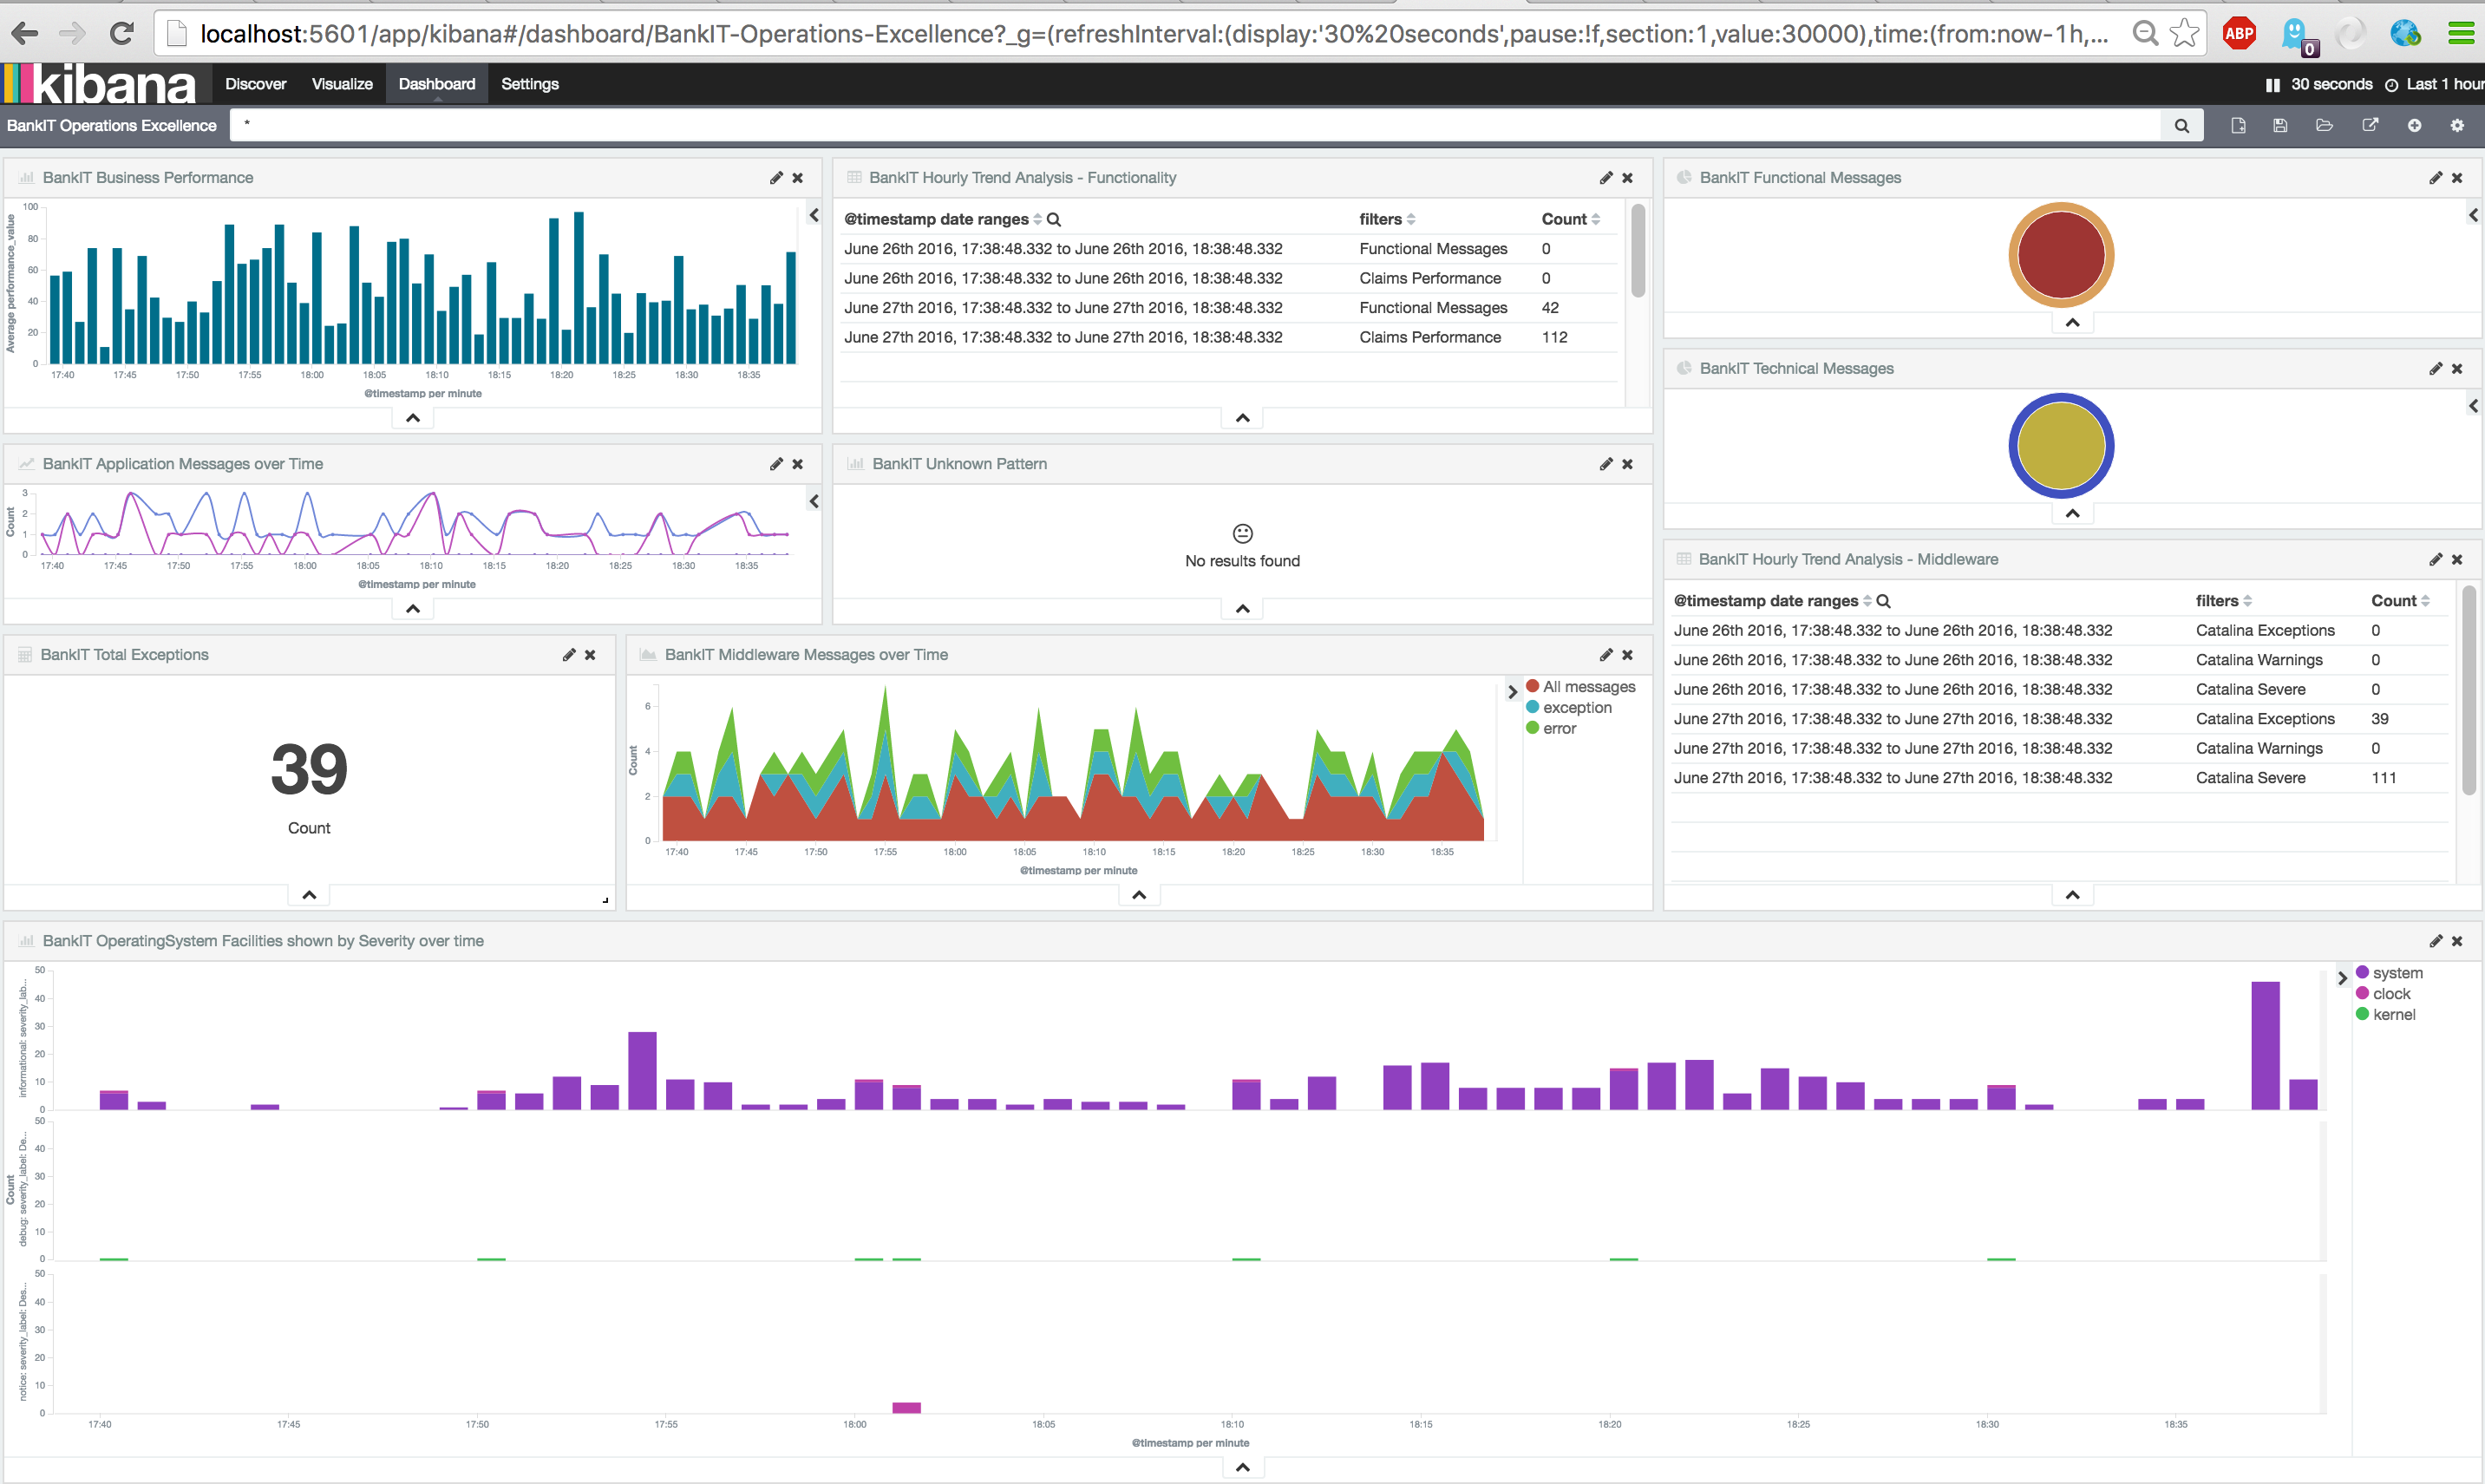
You can use the below screenshot as example to order all 'Visualizations'.
Two weeks after you successfully launched the ELK stack in Production you got overwhelmed with positive feedback. All your ITOps colleagues use the dashboard for solving incidents and analysing the system behaviour. Also the Developers like the approach, but they want to see more metrics related to their application performance. Lead developer Alex already created a Python script for that.
Ben, who is responsible for the performance and capacity wants to keep more data. Also he is missing an overall view of the system metrics like CPU, Memory and storage.
In your previous job you've used Graphite for these tasks. You know about the simple integration with Collectd and the great render API.
You discussed these new requirements with Kenny, who is the Product Owner. Kenny agreed to add new functionality to the current sprint.
Below the functional requirements:
- All System statistics (such as CPU, Memory and storage) must be availabe for dashboarding & reporting.
- Developers must be able to send their metrics to your Graphite instance.
- Grafana dashboard must be available for BankIT Performance & Capacity reporting.
Note : Elastic also has a great set of agents available for this task, called Beats. You must certain evaluate this at home, but is not part of this workshop.
It is time to start collecting metrics. In this simple exercise we will install Collectd from the Epel repository and we will configure it to send the metrics to you local Graphite instance.
See the commands below for installing and configuring your Collectd engine.
Note : Be aware that for this task internet connectivity is needed. For convenience the Epel repository is configured and there is already a cache yum download available.
$ sudo yum -y install collectd
Now we are ready for configuring our collect.d Graphite configuration.
#graphite.conf

LoadPlugin write_graphite
<Plugin write_graphite>
  <Node "datalake">
    Host "localhost"
    Port "2003"
    Protocol "tcp"
    LogSendErrors true
    Prefix "collectd"
    Postfix "collectd"
    StoreRates true
    AlwaysAppendDS false
    EscapeCharacter "_"
  </Node>
</Plugin>
Also you can add additional monitoring configuration.
# additionals.conf

# Default loaded : cpu, memory, load, interface
LoadPlugin entropy
LoadPlugin processes
LoadPlugin users
LoadPlugin df
Now create these files in the /etc/collectd.d/ directory.
Last thing is that we must configure the service configuration. Notice it is using systemd. After that you can start the 'collectd' service.
$ sudo systemctl daemon-reload
$ sudo systemctl enable collectd.service
$ sudo systemctl start collectd.service
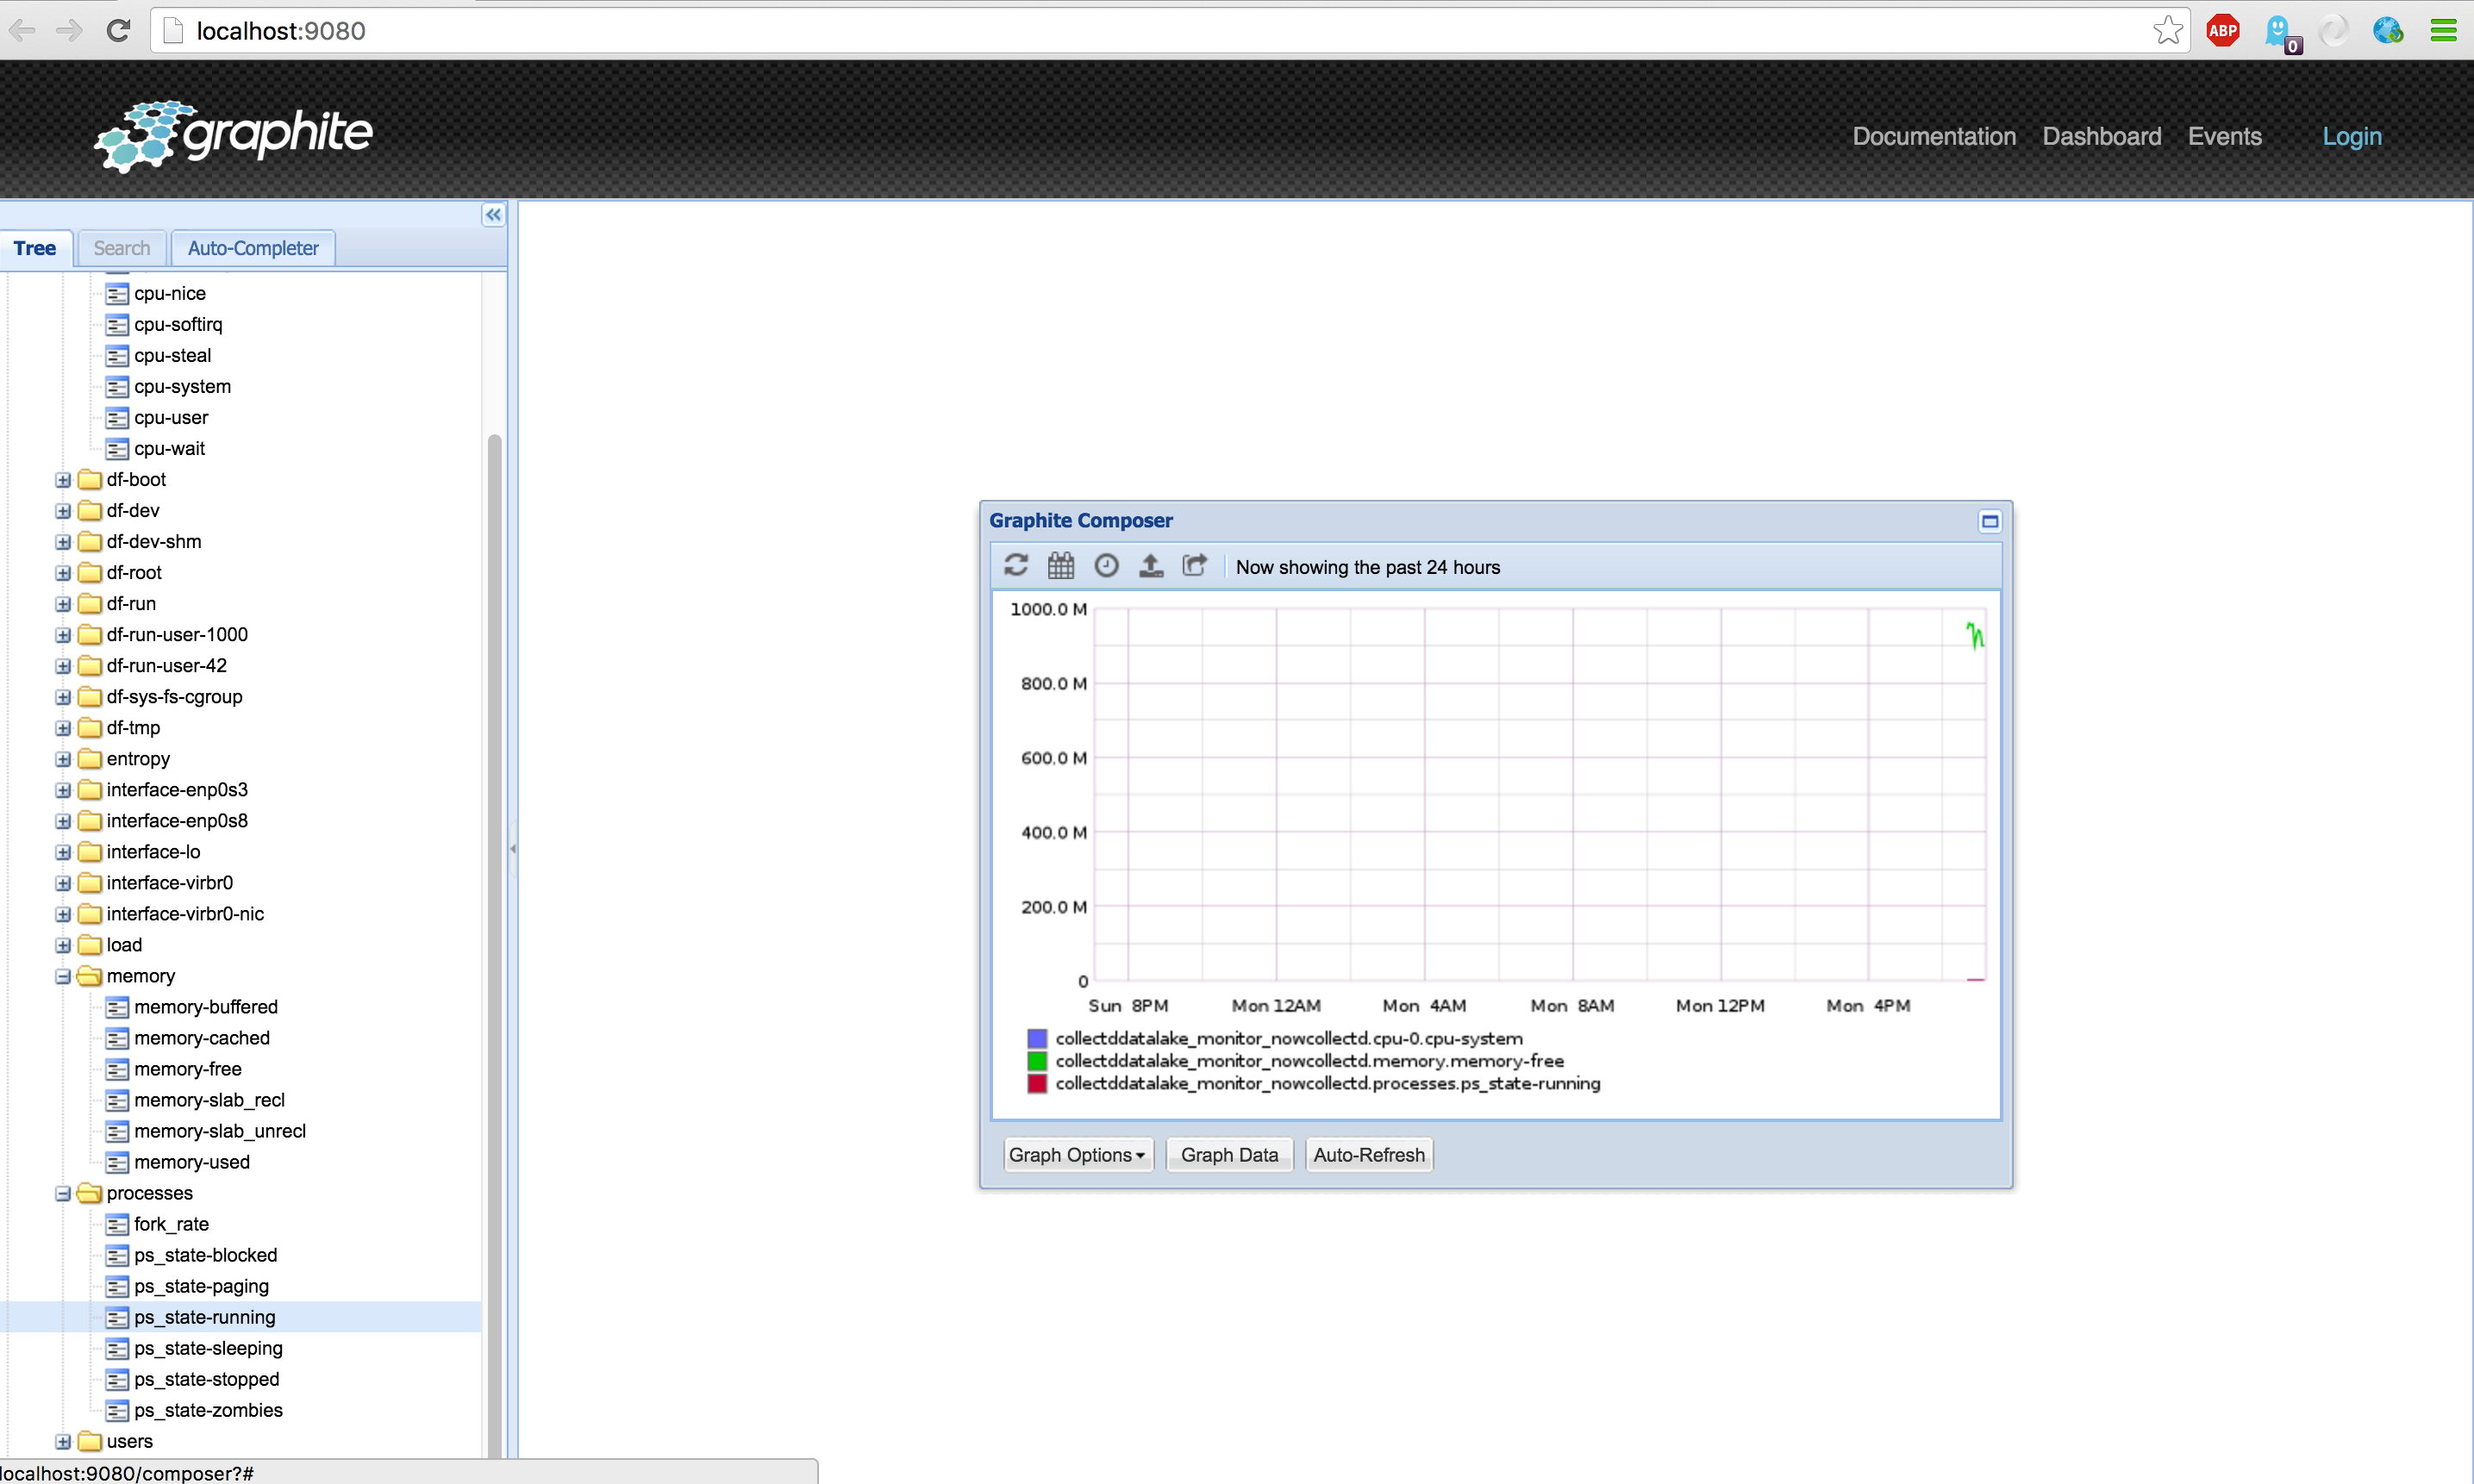
Now open your local Graphite-web page to check if Collectd is correctly sending metrics to Graphite.
First a small introduction in sending metric data to Graphite.Data itself is send over to the Carbon Relay and stored in a Whisper data file. This is the most common situation,but for scaling other implementations exist (like carbon-relay.go, carbon-c-relay, writing to InfluxDB or Cassandra backend).
Graphite has two methods to send data over.
- Plaintext protocol (one by one)
- Pickle protocol (more in a Tuple), which offcourse is more efficient.
Plaintext protocol only requires three parameters to send over. Parameters are:
- Metric name or class path, in our case we will use 'app.bankit.prod.'
- Metric value, which must be an integer or float.
- Time value, which is seconds (Epoch time) since 01-01-1970, see output
date +%s
Now send some test metrics with just a simple one liner.
$ sudo echo "my.dod-ams 2016 $(date +%s)" > /dev/tcp/localhost/2003
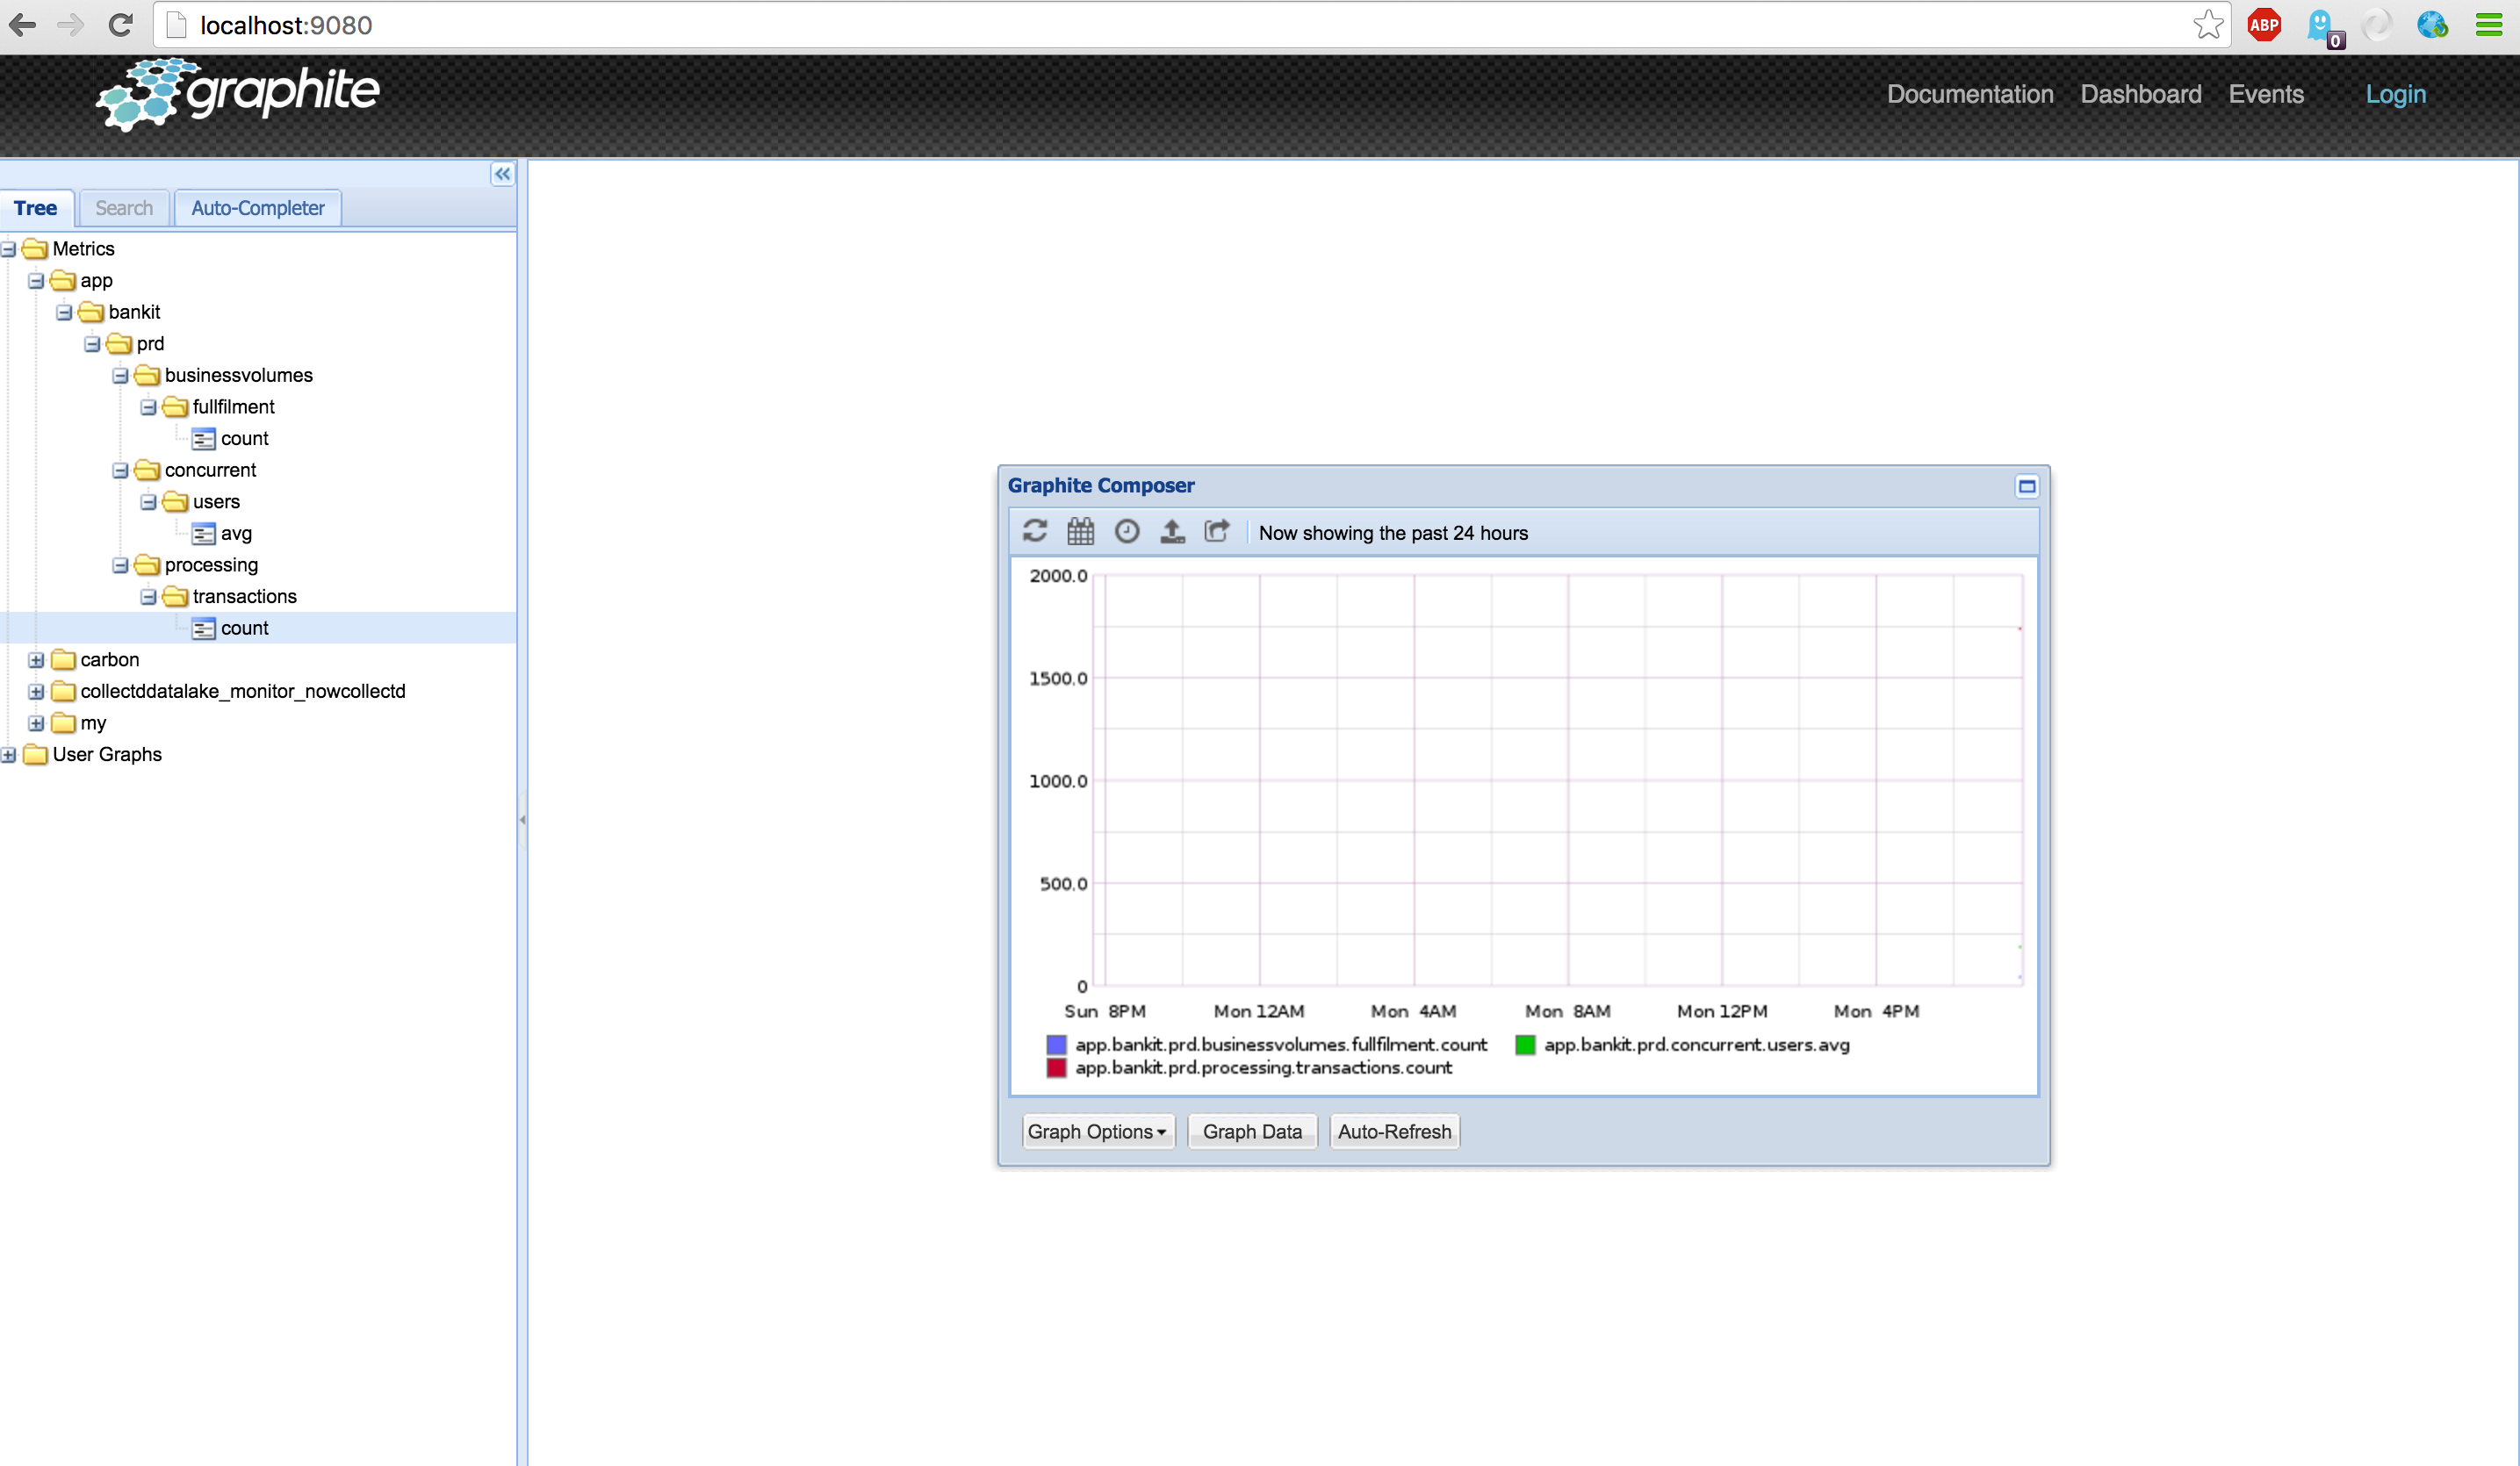
Open your 'graphite-web' and see if your metric name is showing up.
Now we are ready to send some metrics to our Graphite instance. Since Alex already created a Python script we will use this for generating metric events. This generator is available, which is in the DOD-AMS-Workshop package.
Note : Tools and extensions can be found here
$ sudo su -
# cd /usr/local/src/DOD-AMS-Workshop/generator
# ./metric-generator.py &
After starting the metric-generator open the 'graphite-web' again and drill down to the metrics to show the graph .
Since we have started our metric-generator it is time to configure our Grafana instance. Grafana is a clone from Kibana and evolved in a mature dashboard application for metric data.
In this section we will
- Small introduction in Grafana.
- Configure our data sources, which will be Graphite and Elasticsearch.
- Create our dashboard with all required information.
As mentioned above Grafana is a successful clone of the Kibana(3) build, which is evolved to a great dashboarding tool. As with Kibana3 the concept of Rows and Panels is used. One big advantage is that Grafana supports multiple data sources (such as Graphite, Elasticsearch and InfluxDB).
In short your dashboard is build out of various rows. Practice could be to make use of three rows, which functional bundles the metric data (one or more queries ). To make the content available you must first add one or more panels. You can select many types of panels
- Singlestat
- Graph
- Table
- Text
- Dashboard list
- Plugin list
In the exercise we will create some singlestat, graph and table panels from various data sources.
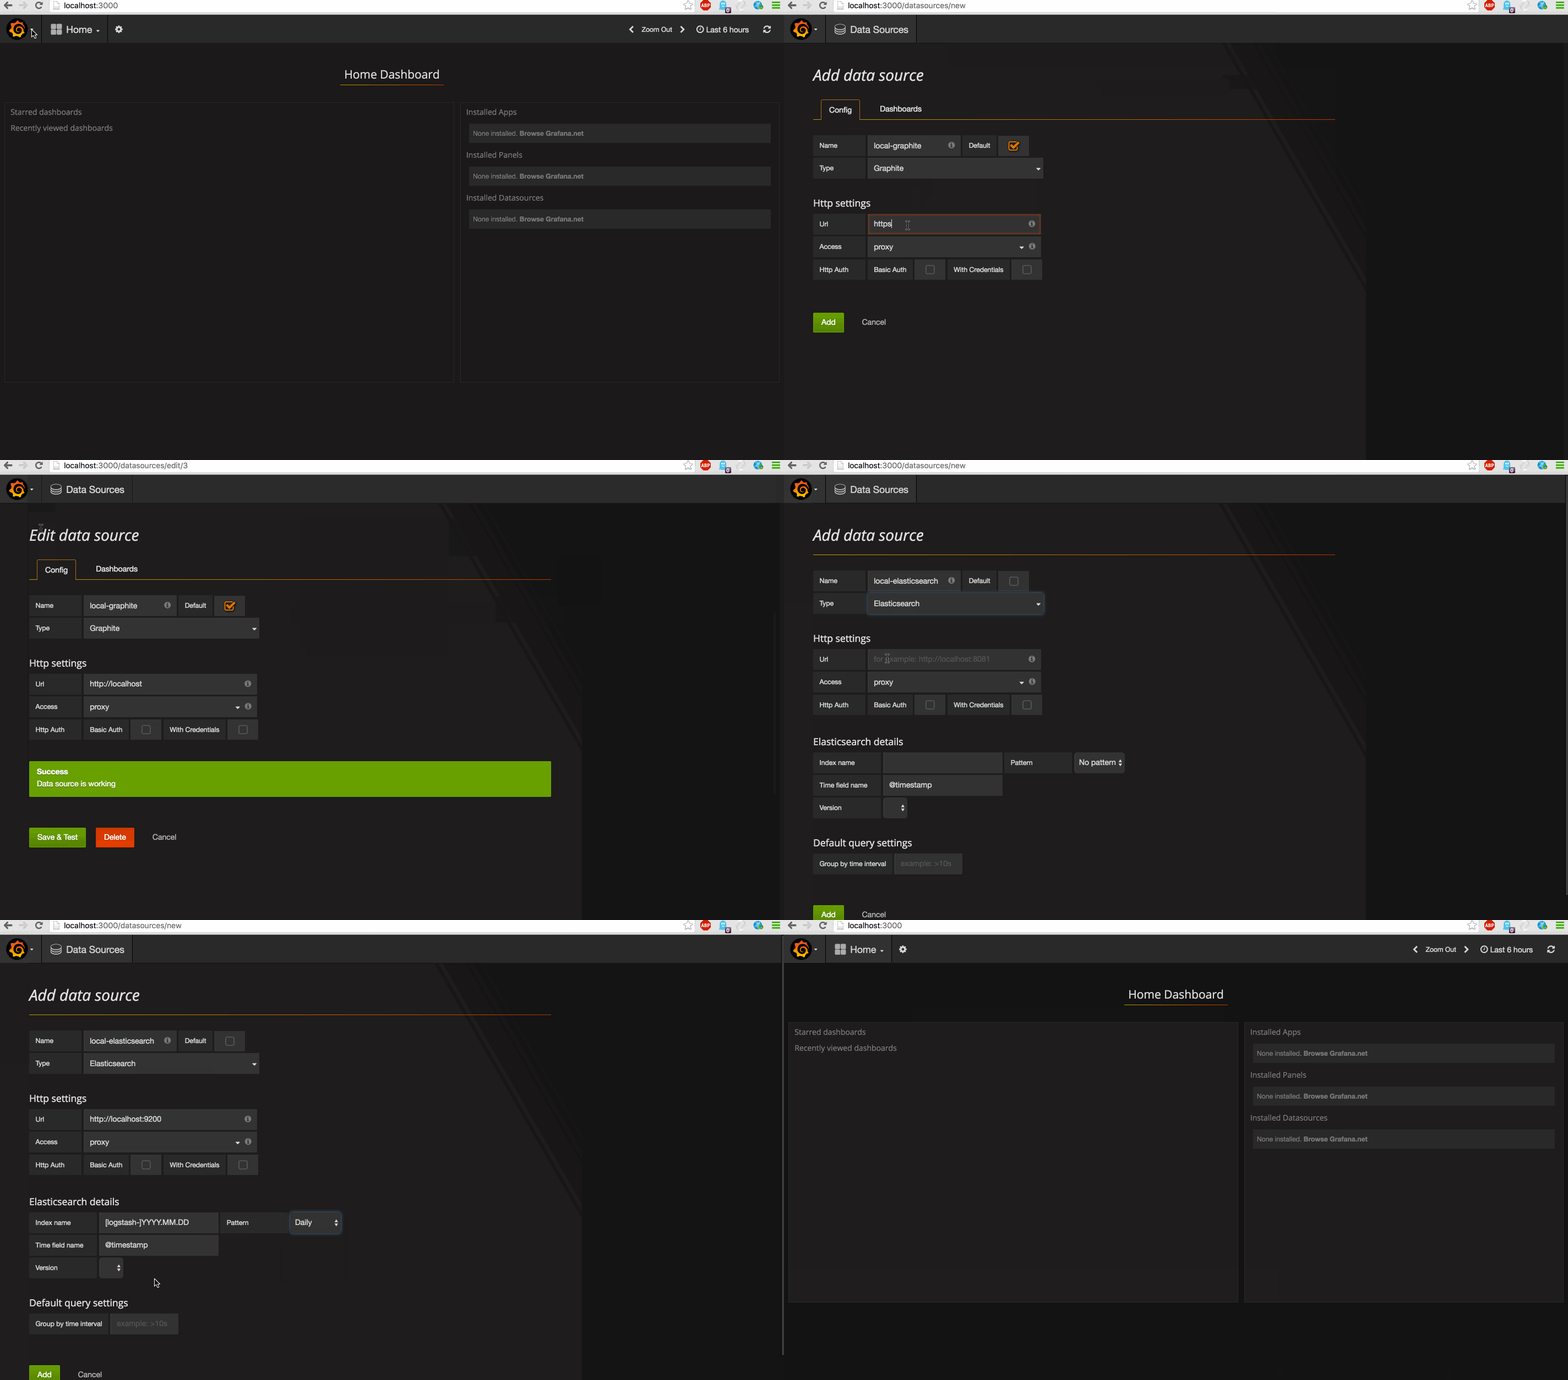
First we will configure our data sources. Since version 2.5 we can also connect Elasticsearch datasources. This is very cool, since we have one metric (performance_value) available.
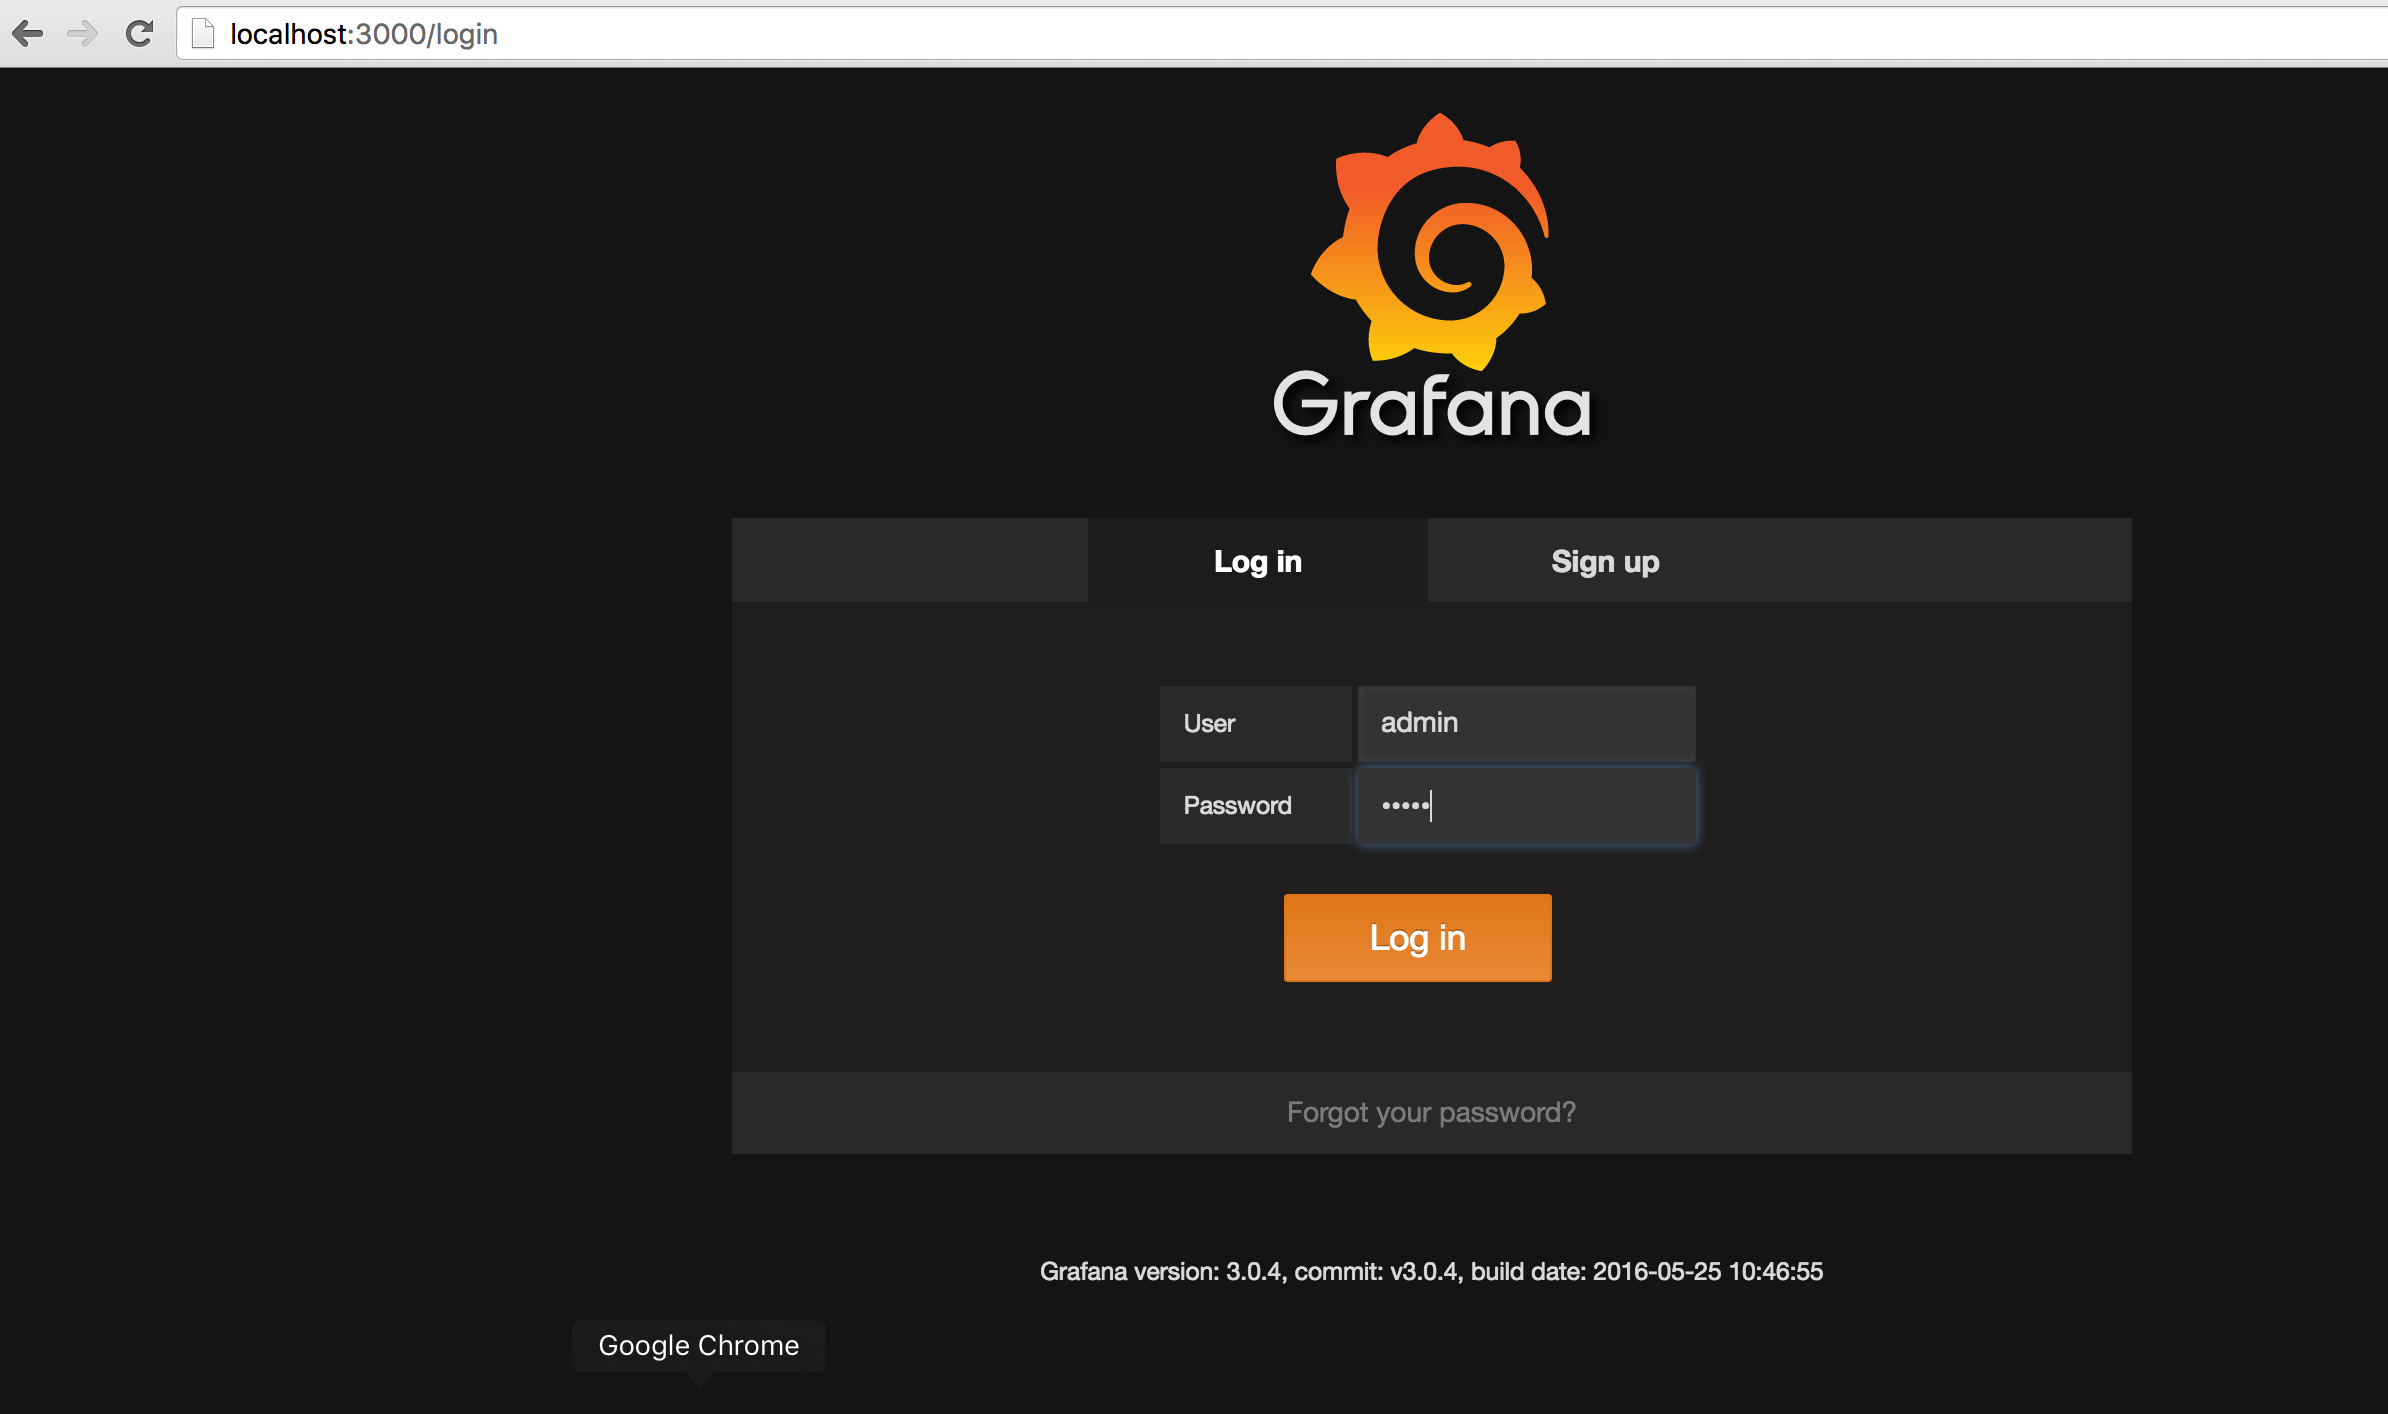
Open your local grafana instance. You can login with the default username & password ( admin/admin)
Now look at the following instruction video how to add the Graphite and Elasticsearch datasources.
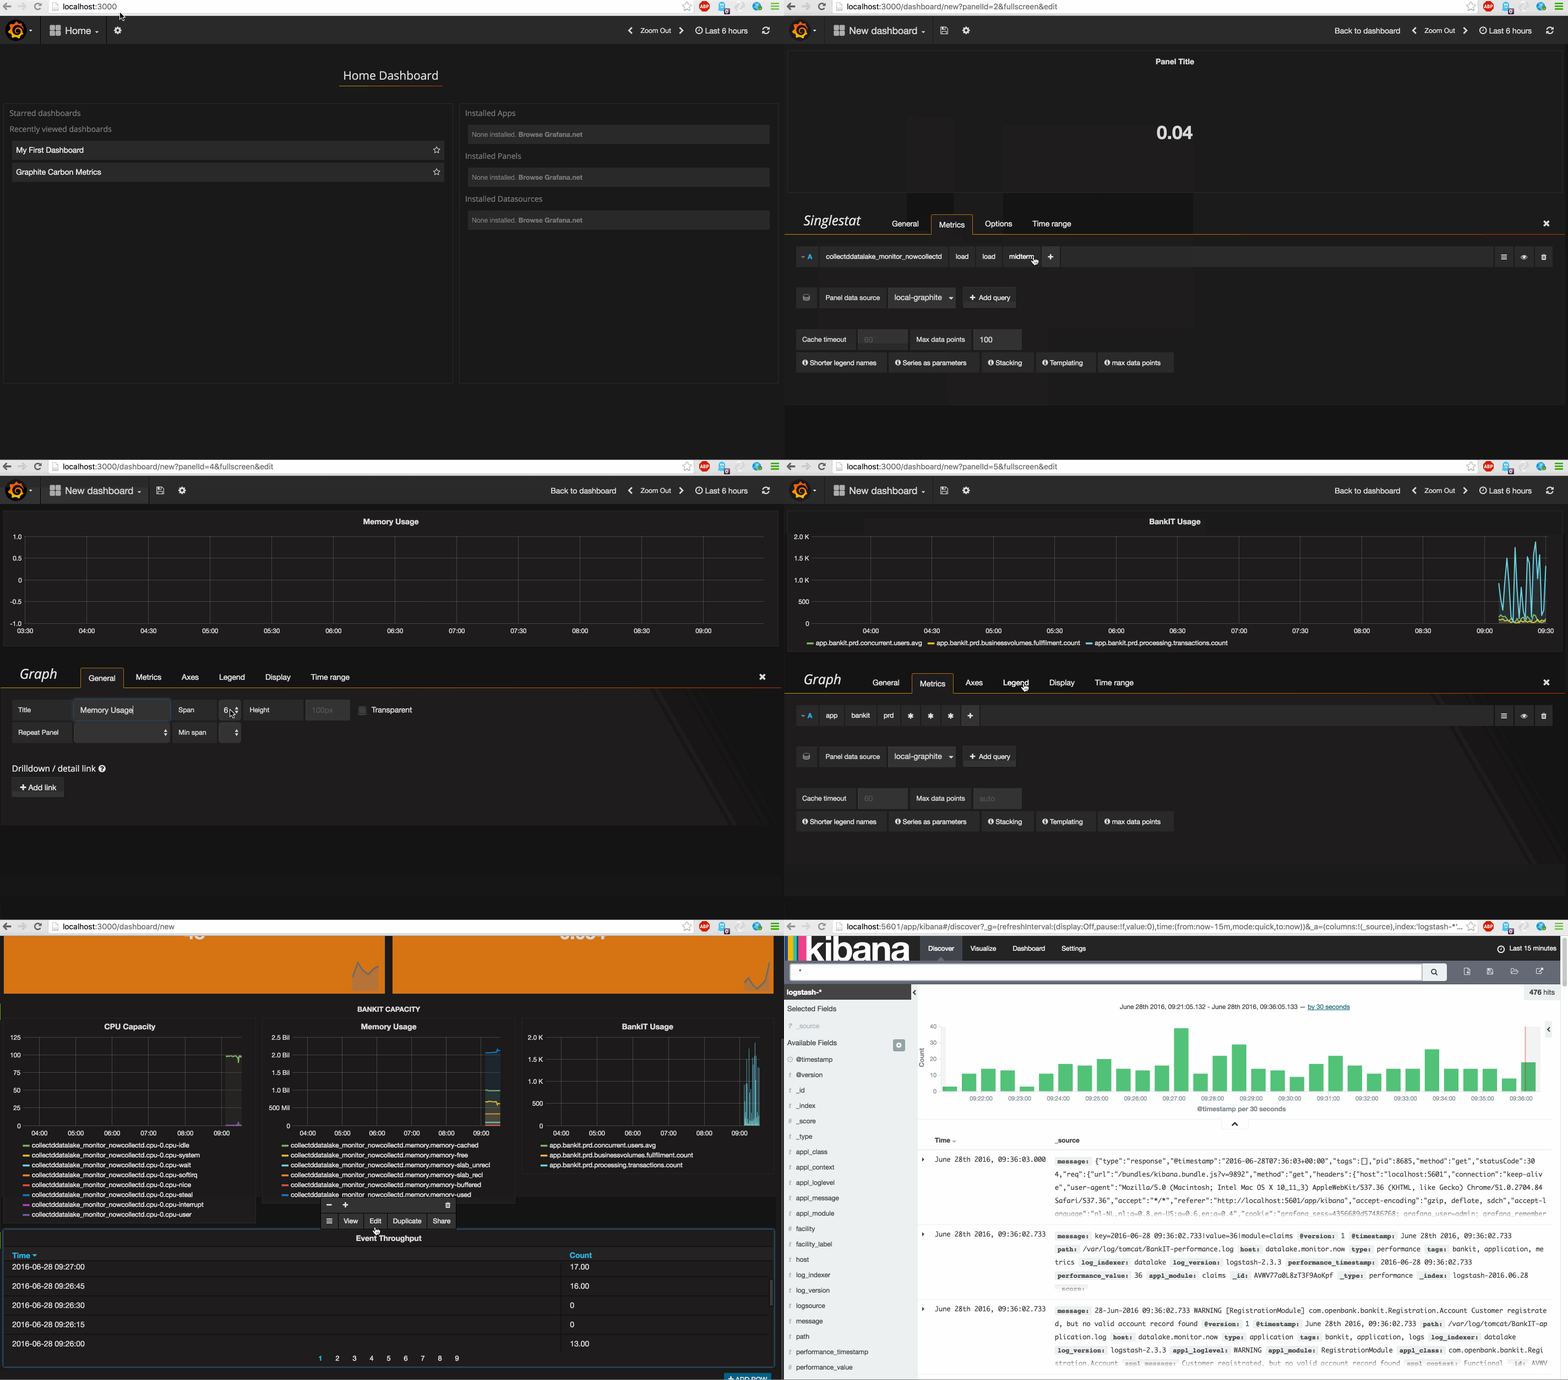
It's time to add the datasources yourself.Open the local grafana console and create some awesome dashboards.
Before creating the dashboard you can first look at the following instruction video, which explains how to add the various type of panels to your rows and configure the queries.
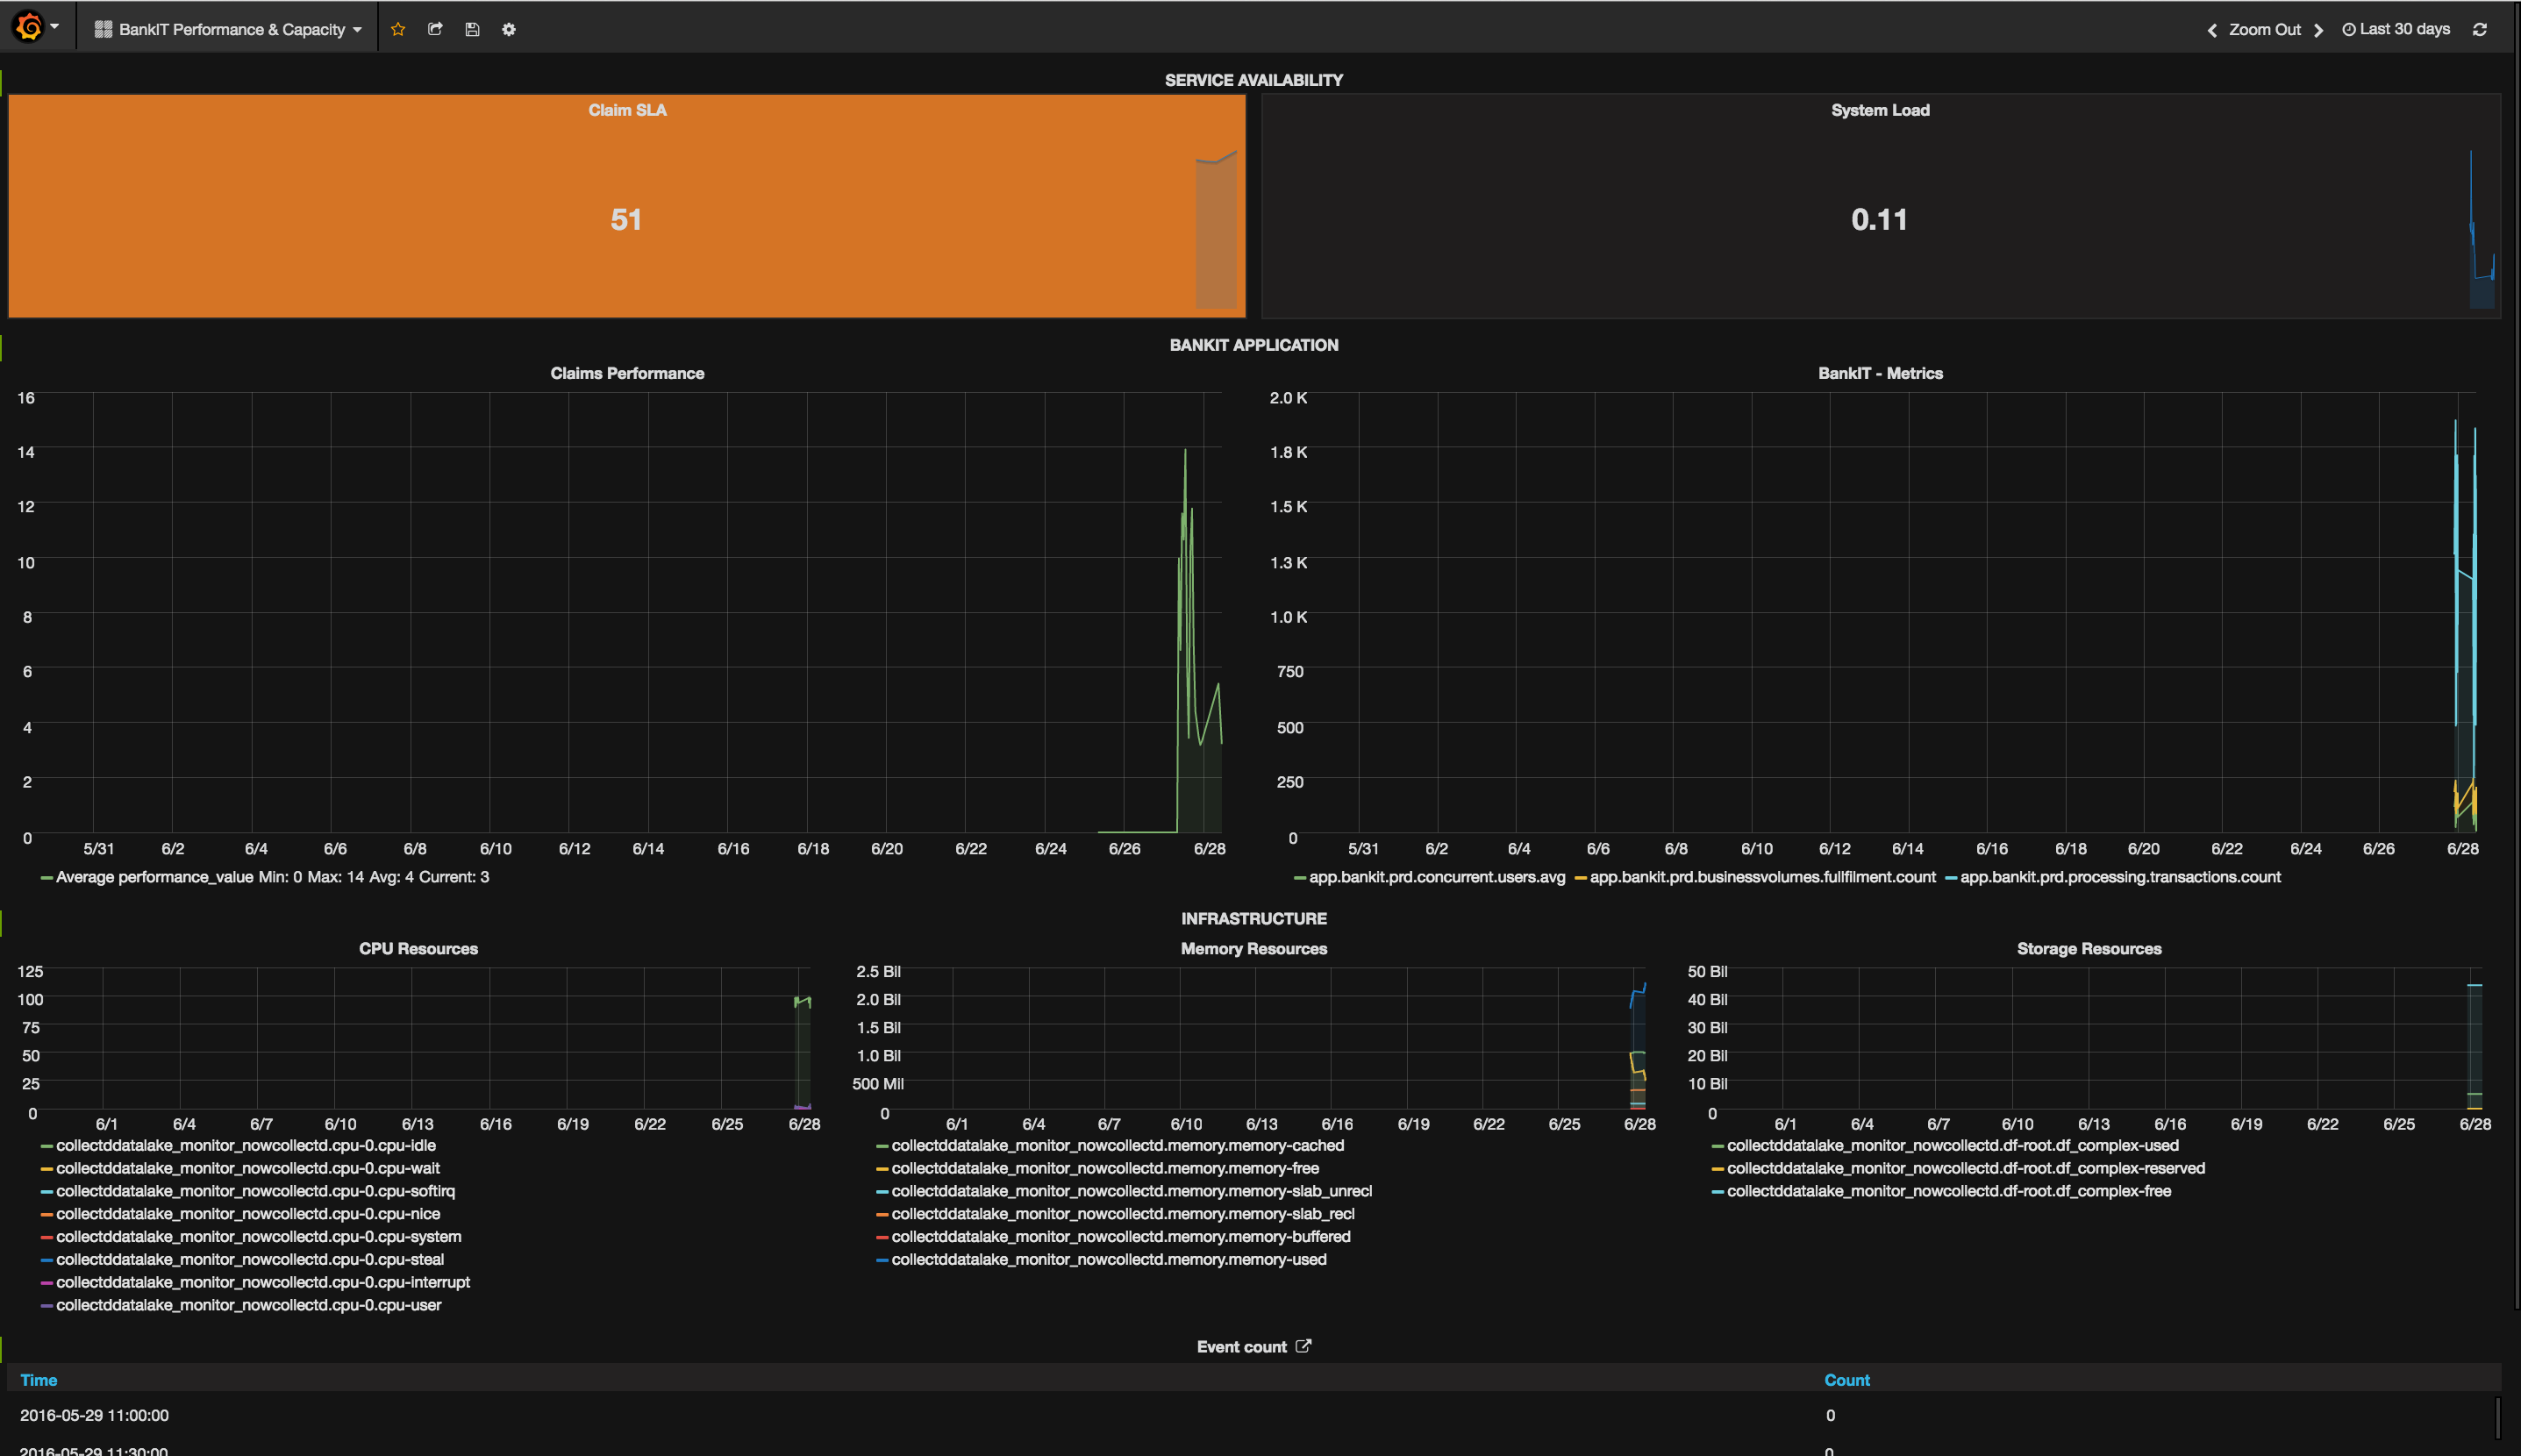
Enough instruction videos, let's start creating some metric dashboards with grafana. Use the table below for creating your "BankIT Performance & Capacity" dashboard.
Row Name | Panel Name,Span | Panel Type | Metric Datasource | Metric Query | Options/Display ---------|----------|--------|--------|------------|--------------|-------- Service Availability | Claim SLA,6 | Singlestat | local-elasticsearch | Metrics: Average(performance_value), Group by: Date histogram(@timestamp) | Coloring:Background, Sparklines: Show, Background mode Service Availability | System Load,6 | Singlestat | local-graphite | collectddatalake_monitor_nowcollectd.load.load.longterm | Coloring:Background, Sparklines: Show, Background mode BankIT Application | Claims Performance,6 | Graph | local-elasticsearch | Metrics: Average(performance_value), Group by: Date histogram(@timestamp) | Draw Modes:Lines BankIT Application | BankIT - Metrics,6 | Graph | local-graphite | app.bankit.prd...* | Draw Modes: Lines, Multiple Series:Stack Infrastructure | CPU Resources,4 | Graph | local-graphite | collectddatalake_monitor_nowcollectd.cpu-0.* | Draw Modes: Lines Infrastructure | Memory Resources,4 | Graph | local-graphite | collectddatalake_monitor_nowcollectd.memory.* | Draw Modes: Lines Infrastructure | Storage Resources,4 | Graph | local-graphite | collectddatalake_monitor_nowcollectd.df-root.* | Draw Modes: Lines ELK Stack, not visible | Event count,12 | Table | local-elasticsearch | Metrics: Count(), Group by: Date Historygram(@timestamp) | General:Drilldown:Type: Absolute, Url http://localhost:5601/, Title Data Lake, Open in new tab
You can have a sneak preview on the results, by looking at the screenshot below.
During the successful sprint demo one of the stakeholders asked about the possibilities of Broker connectivity. Drake who is the architect for messaging suggests to use Kafka. Kafka is already the core enterprise messaging system (EMS) between all the application components and it's easy to extend the EMS with two additional topics for 'events' and 'metrics' distribution to the data lake.Also other applications can then easily connect to the data lake.
You as engineer know that logstash has an input plugin available for Kafka and also Alex want to help you setup some Java workers, which will do the work for 'Producing' and 'Consuming' the data. At the end of the demo everybody agreed to implement this functionality quickly, because of the launch of a new innovative product called "FinCoach".
Below the functional requirements:
- Kafka must be extended with two additional topics.
- Logstash Indexer must be extended to consume the event topic.
- Current Java framework must be extended to produce event and metric data to the correct topics.
- Java worker must be created to consume metrics from a topic and send them to the graphite carbon-relay.
Now it's time to setup a Kafka EMS instance. Working with Kafka looks difficult, but setting up a single running instance is quite easy.
As already mentioned above, Kafka is a high-throughput distributed messaging system, which is based on the publish&subscribe mechanism. Also some nice benefits are.
- Fast processing by handling read/write from thousand of clients, with various data sizes.
- Messages are persisted on disk, which is very Durable.
- Besides above it is very scalable and distributed by nature.
Note : Be aware that for this task internet connectivity is needed. For convenience there is already a cache version available.
To get started type the following commands in your terminal.
$ sudo su -
# cd /opt
# tar -xvzf /usr/local/src/kafka_2.11-0.10.0.0.tgz
# ln -s /opt/kafka_2.11-0.10.0.0 /opt/kafka
# useradd kafka
# chown -R kafka.kafka /opt/kafka_2.11-0.10.0.0
# chown -h kafka.kafka /opt/kafka
Now that the binaries are in-place we can create our systemd scripts in '/etc/systemd/system'. Below an example 'kafka' and 'kafka-zookeeper' script.
kafka.service
# /etc/systemd/system/kafka.service

[Unit]
Description=Apache Kafka server (broker)
Documentation=http://kafka.apache.org/documentation.html
Requires=network.target remote-fs.target
After=network.target remote-fs.target kafka-zookeeper.service

[Service]
Type=simple
User=kafka
Group=kafka
ExecStart=/opt/kafka/bin/kafka-server-start.sh /opt/kafka/config/server.properties
ExecStop=/opt/kafka/bin/kafka-server-stop.sh

[Install]
WantedBy=multi-user.target
kafka-zookeeper.service
# /etc/systemd/system/kafka-zookeeper.service

[Unit]
Description=Apache Zookeeper server (Kafka)
Documentation=http://zookeeper.apache.org
Requires=network.target remote-fs.target
After=network.target remote-fs.target

[Service]
Type=simple
User=kafka
Group=kafka
ExecStart=/opt/kafka/bin/zookeeper-server-start.sh /opt/kafka/config/zookeeper.properties
ExecStop=/opt/kafka/bin/zookeeper-server-stop.sh

[Install]
WantedBy=multi-user.target
Now that we created the two service files we can open our firewall ports.
$ sudo su -
# cd /usr/lib/firewalld/services
# vi kafka.xml

<?xml version="1.0" encoding="utf-8"?>
<service>
  <short>Kafka</short>  <description>Kafka Broker API</description>
  <port protocol="tcp" port="9092"/>
</service>

# vi kafka-zookeeper.xml

<?xml version="1.0" encoding="utf-8"?>
<service>
  <short>Kafka-zookeeper</short>  <description>Kafka-Zookeeper API</description>
  <port protocol="tcp" port="2181"/>
</service>

# firewall-cmd --permanent --add-service kafka
# firewall-cmd --permanent --add-service kafka-zookeeper
# firewall-cmd --reload
Now first add the following parameters to the /opt/kafka/config/server.properties
listeners=PLAINTEXT://localhost:9092
advertised.listeners=PLAINTEXT://localhost:9092
We can configure the service configuration and start the service. Notice it is using systemd
$ sudo systemctl daemon-reload
$ sudo systemctl enable kafka.service
$ sudo systemctl enable kafka-zookeeper.service
$ sudo systemctl start kafka-zookeeper.service
$ sudo systemctl start kafka.service
Now it's time to create the two required topics, called 'events' and 'metrics'
$ cd /opt/kafka/bin
$ ./kafka-topics.sh --create --zookeeper localhost:2181 --replication-factor 1 --partitions 1 --topic events
$ ./kafka-topics.sh --describe --zookeeper localhost:2181 --topic events
$ ./kafka-topics.sh --create --zookeeper localhost:2181 --replication-factor 1 --partitions 1 --topic metrics
$ ./kafka-topics.sh --describe --zookeeper localhost:2181 --topic metrics
You can test the EMS with the following commands, using the 'stdin' and 'stdout'.
$ cd /opt/kafka/bin
$ ./kafka-console-consumer.sh --zookeeper localhost:2181 --topic events --from-beginning &
[1] 5541
$ ./kafka-console-producer.sh --broker-list localhost:9092 --topic events
Hello DevOpsDays AMS2016
Hello DevOpsDays AMS2016
<CTRL-C>
$ fg 1
<CTRL-C>
Now that you know the EMS is working you can start working on the logstash configuration.
One of the nice things of logstash that it supports many input channels, like Kafka. As we just setup Kafka and created a topic called 'events' we will create the configuration for that.
Now add/extend the following input filter to our /etc/logstash/conf.d/000-input.conf file.
#000-input.conf

kafka {
	topic_id   => "events"
	group_id   => "datalake"
	type	   => "application"
	zk_connect => "localhost:2181"
	decorate_events => true
        tags       => ["kafka","application","logs","bankit"]
}
Now we have to extend our our /etc/logstash/conf.d/500-filter.conf file.
Be very carefull, since you have to update some code. Below the steps, which you need to do.
- Add an additional match.
- Put the 'mutate' and the 'date {}' filter for the logfile timestamp between an If statement.
- Put another Else If for syncing the timestamp from Kafka to the @timestamp field.
First the match. Put this after the line match => ["message", "%{MONTHDAY:tmp_mday
match => [ "message", "%{LOGLEVEL:appl_loglevel} \[%{DATA:appl_module}\] %{DATA:appl_class} %{GREEDYDATA:appl_message}" ]
Create the If statement,which will hold the mutate and the date for logfile timestamp handling.
if [tmp_mday] {
                	mutate {
                        	add_field => { "timestamp" => "%{tmp_mday}-%{tmp_month}-%{tmp_year} %{tmp_time}" }
                        	remove_field => [ "tmp_mday","tmp_month","tmp_year","tmp_time" ]
                	}

                	date {
                        	match => [ "timestamp", "dd-MMM-yyyy HH:mm:ss.SSS" ]
                        	remove_field => [ "timestamp" ]
                	}
}
Add the additional 'else if' to this 'if' statement.
else if "kafka" in [tags] {
		date {
                           match => [ "timestamp", "ISO8601" ]
                           remove_field => [ "timestamp" ]
               	}
}
Create one file called /tmp/events.txt with the content below.
SEVERE [NAWModule] com.openbank.bankit.NAWModule.Update John Doe record updated with Flevostraat 100, Purmerend
WARNING [RegistrationModule] com.openbank.bankit.Registration.Account Customer registrated, but no valid account record found
INFO [HouseKeepingModule] com.openbank.bankit.HouseKeeping.Export Export started for main customer info
Now you can build the package and start the Java worker to generate events.
Note : You can stop the
log-generator.pyscript, but it will not harm the Java worker.
$ cd /usr/local/src/DOD-AMS-Workshop/generator/datalake-loadgenerator
$ mvn package
$ cd /usr/local/src/DOD-AMS-Workshop/generator/datalake-loadgenerator
$ cp events.txt /tmp/events.txt
$ target/datalake-loadgenerator producer &
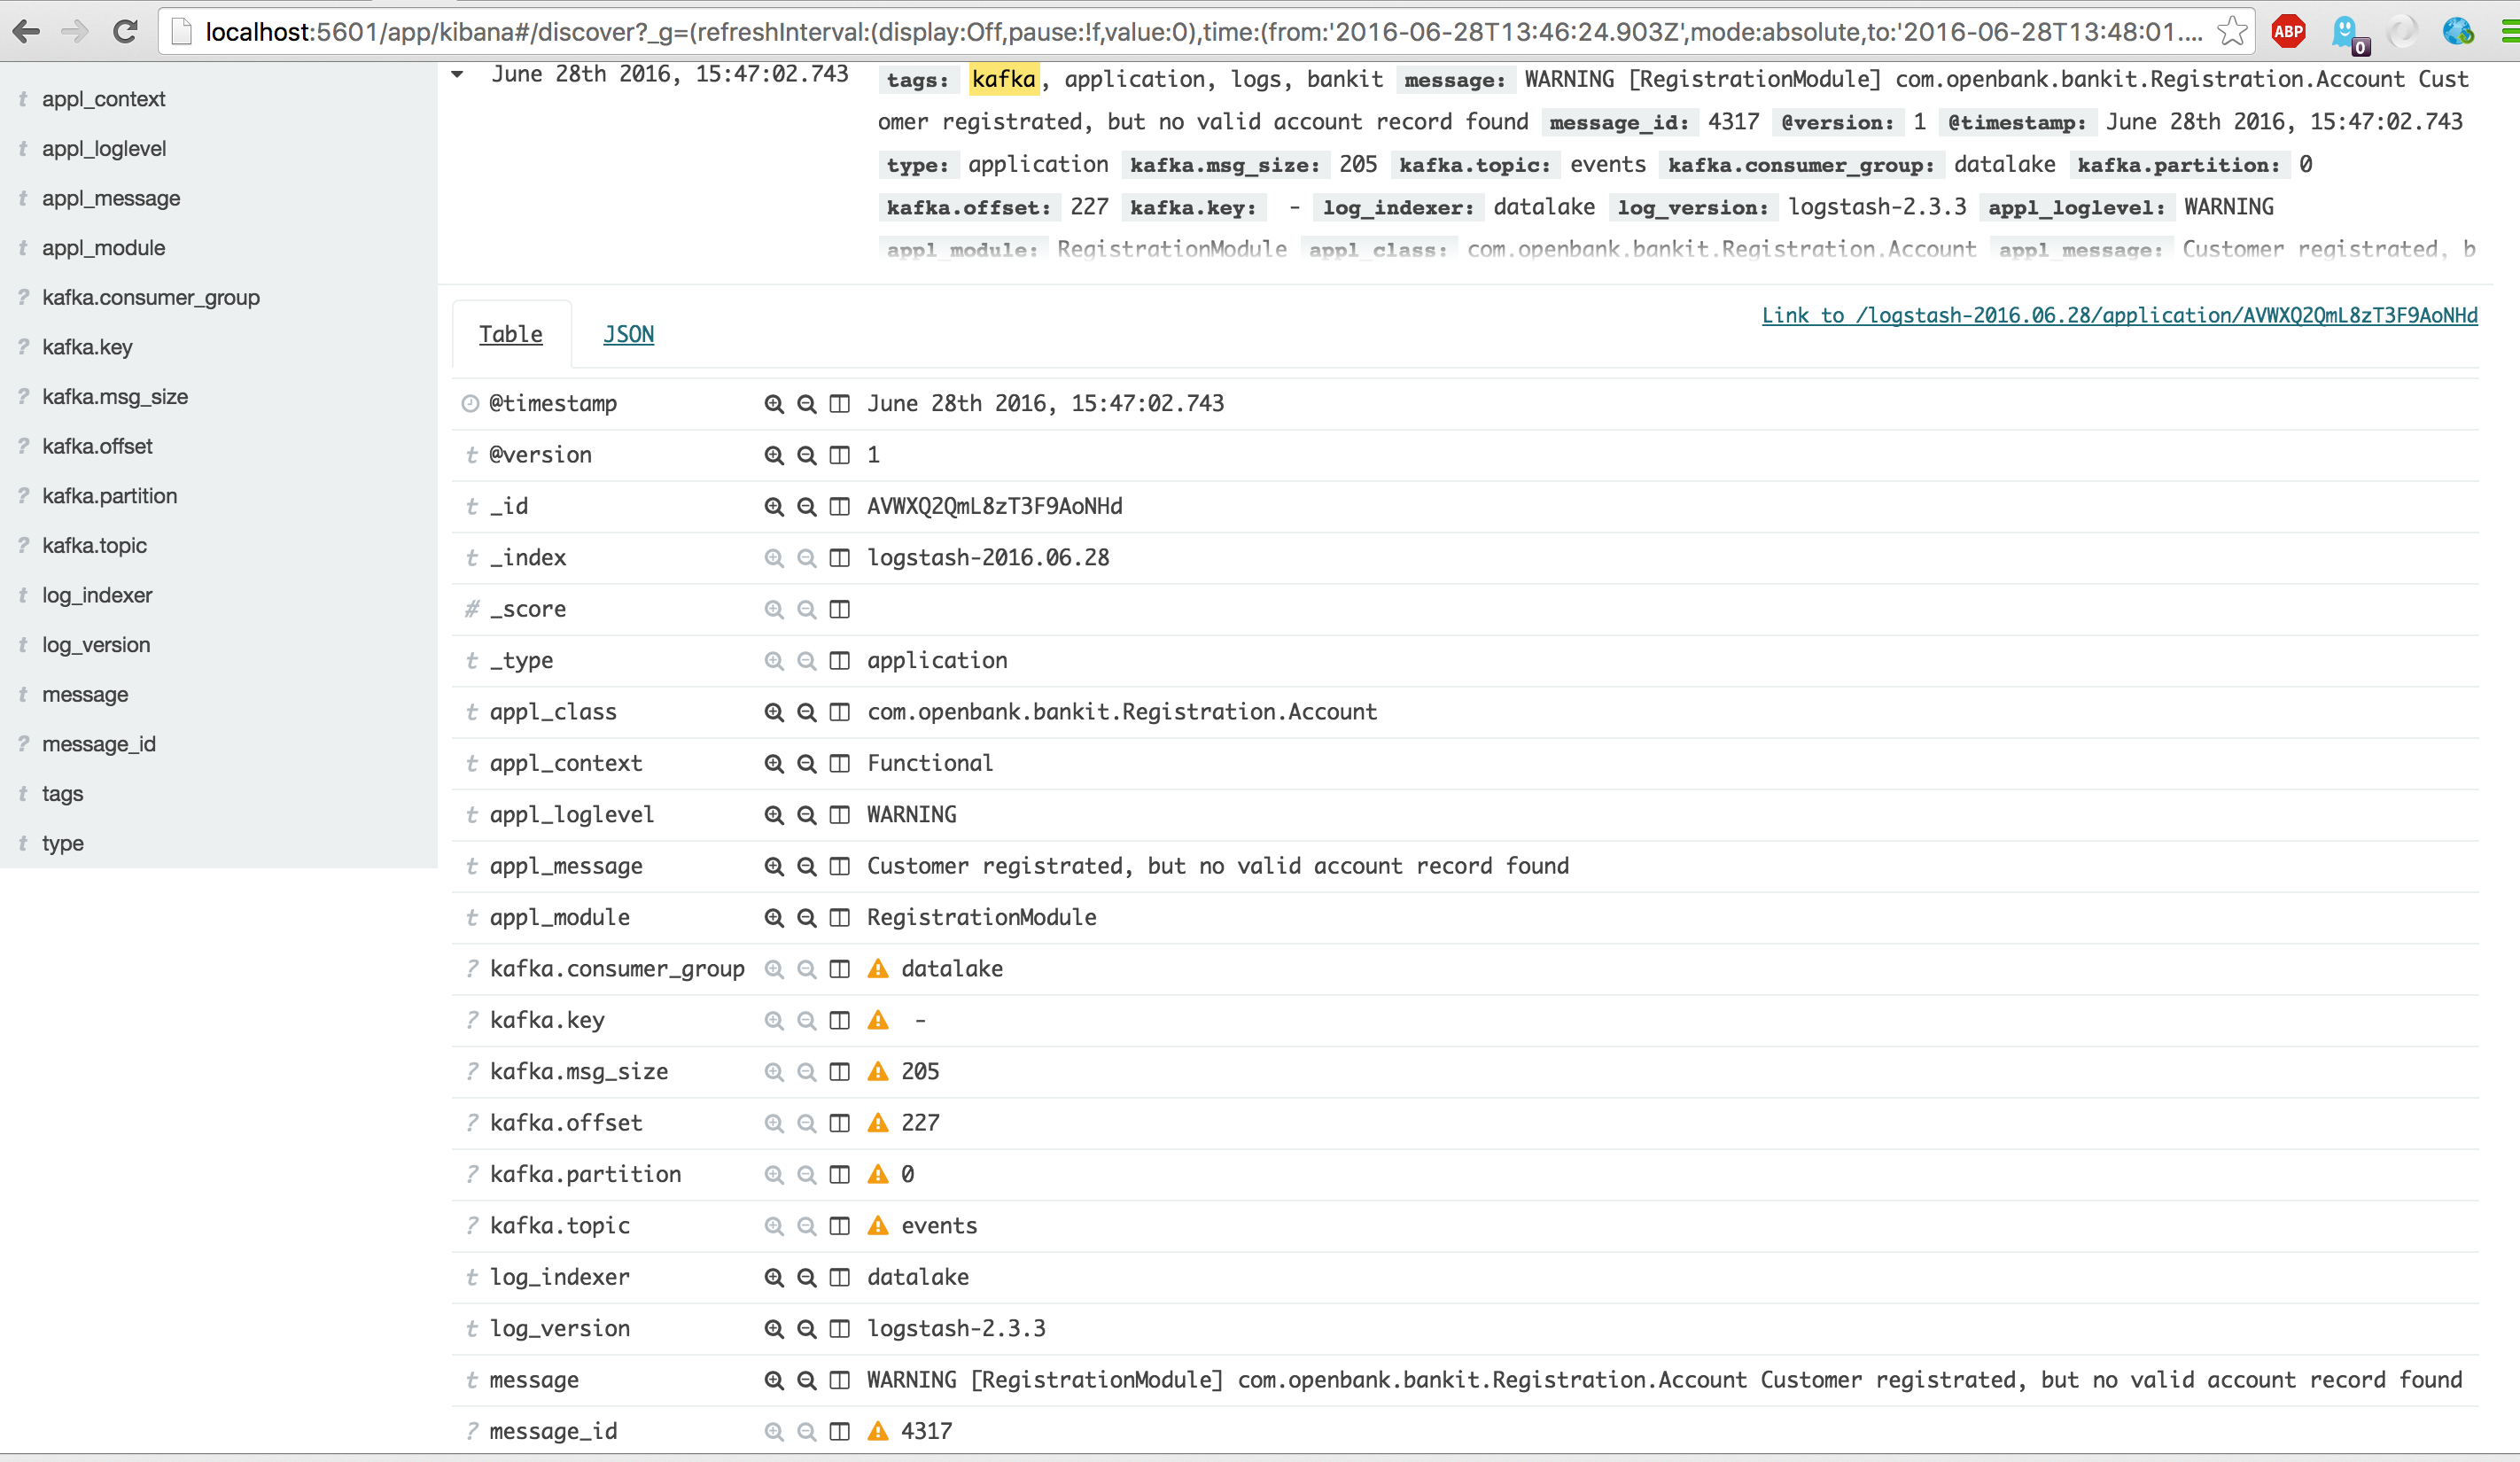
Now open your Kibana dashboard again and search for tags:"kafka". This will show all kafka submitted events coming in.
See below for the example.Notice the additional kafka fields.
Now that we compiled our Maven package. Also the the Producer and the Consumer Graphite Kafka API is available. To test this you must type the following commands.
First create the /tmp/metrics.txt file and kill the metric-generator script.
app.bankit.prd.businessvolumes.fullfilment.count;100
app.bankit.prd.processing.transactions.count;2000
app.bankit.prd.concurrent.users.avg;200
$ kill $(ps -ef | grep metric-generator | grep -v grep | awk '{print $2}')
$ cd /usr/local/src/DOD-AMS-Workshop/generator/datalake-loadgenerator
$ cp metrics.txt /tmp/metrics.txt
$ target/datalake-loadgenerator graphiteproducer &
$ target/datalake-loadgenerator consumer
Now open Graphite-web or Grafana to see if the dashboards are still updated.
This is the END . I hope you enjoyed the workshop.

