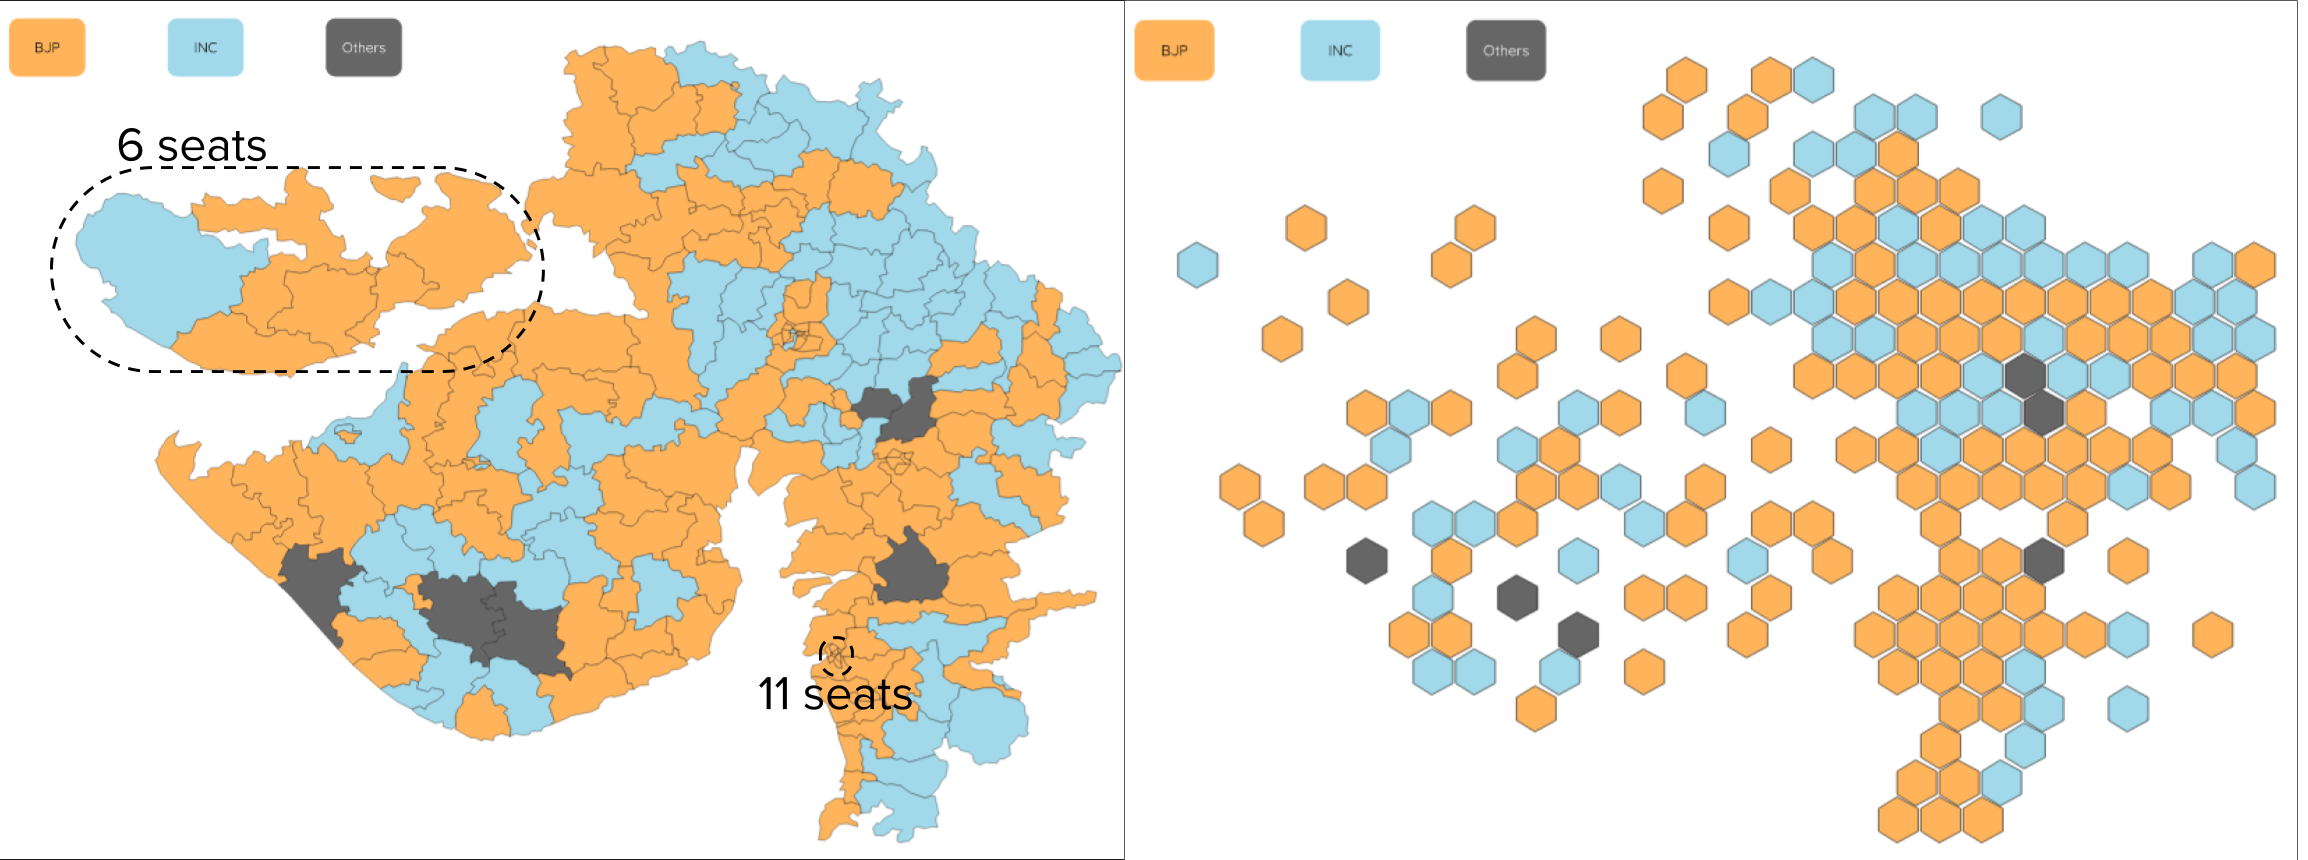
A Python script that converts a Shapefile, GeoJSON, or CSV to an equal area cartogram SVG or GeoJSON
Python script for creating Equal-Area Hexagonal Cartograms.
pip install --upgrade git+https://github.com/rishsriv/EqualAreaCartogram/
from eqcart import Cartogram
#input_filepath can be the location of a GeoJSON, SHP, CSV, or Excel File
cart = Cartogram(input_filepath, name_of_column_w_unique_ids, num_x_grid, num_y_grid)
cart.make_hex_svg(output_filepath) #for creating SVG
cart.make_hex_geojson(output_filepath) #for creating GeoJSON
For more details on usage, see this notebook
pandas
geopandas
Send an email at [email protected] or tweet at @srivrish if you have any questions.
The input file can be any of the following formats:
- CSV/Excel*
- SHP
- GeoJSON
*if a csv or excel file is used as input, latitude and longitude columns that represent the latitude and longitude of each area must be present. If you do not know what the latitude and longitude of each area are, use this handy Google Spreadsheets tool and export the end result as a CSV.
For details on implementation, see this notebook
- Get the x_coord (latitude) and y_coord (longitude) of each area
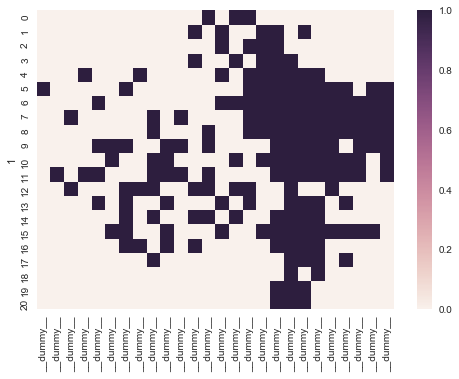
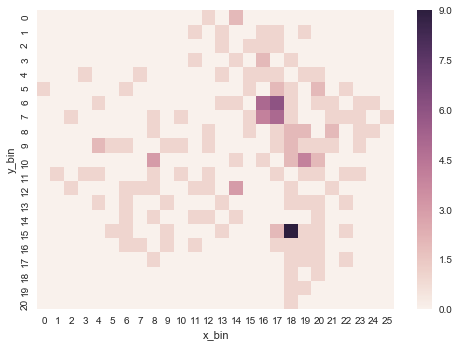
- Normalize the x_coords and y_coords to align all points into a rectangular grid with a length and width that you define. This will create a matrix that is something like the image below
-
If a bin (i.e., an x-y coordinate pair) has more than 1 point, select a point from the bin and shunt it to a neighbouring bin if neighbouring bin is empty. If no neighbouring bin is empty find a direction (up, down, left, or right) with the most proportion of empty spaces, shift all existing points in that direction by 1, and then move the selected point into that direction
-
Iterate 3. until all bins only have 1 point in them. This will lead to a matrix that is something like the image below

-
Convert the matrix obtained from point 4 into an SVG or GeoJSON with hexagon polygons. The code for this is based on the excellent chorogrid library by David Taylor.
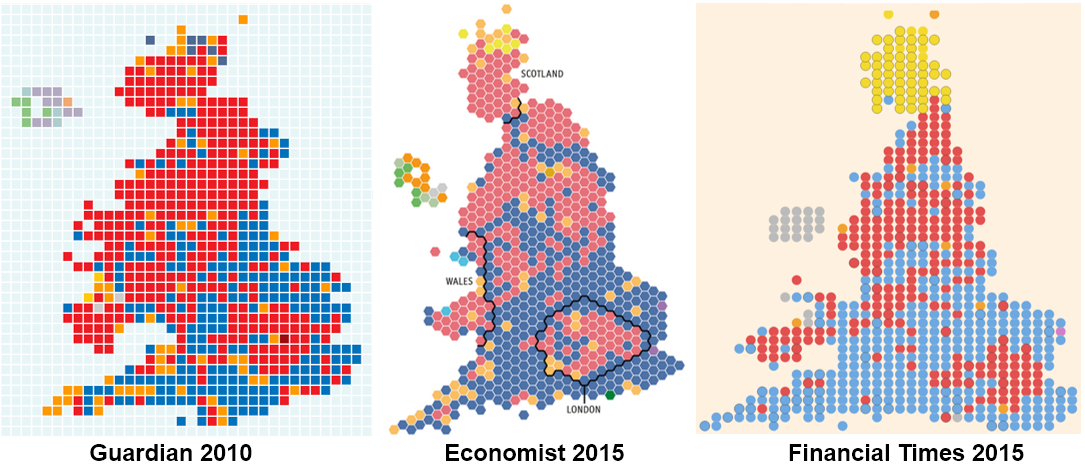
Choropleths fail to adequately highlight geographically small areas. This becomes particularly pertinent when covering elections, where each constituency has the same weight regardless of its geographical size. Equal area cartograms solve this problem, and have been used fairly effectively by a number of news organizations - as shown in the image below (taken from Richard Brath's excellent blog
However, making equal area cartograms can be a time consuming process - particularly for relatively obscure regions where well-designed SVGs of equal area cartograms are not easily available. While there is an R implementation for producing these, I could not find a Python implementation.


